Fig. 2.
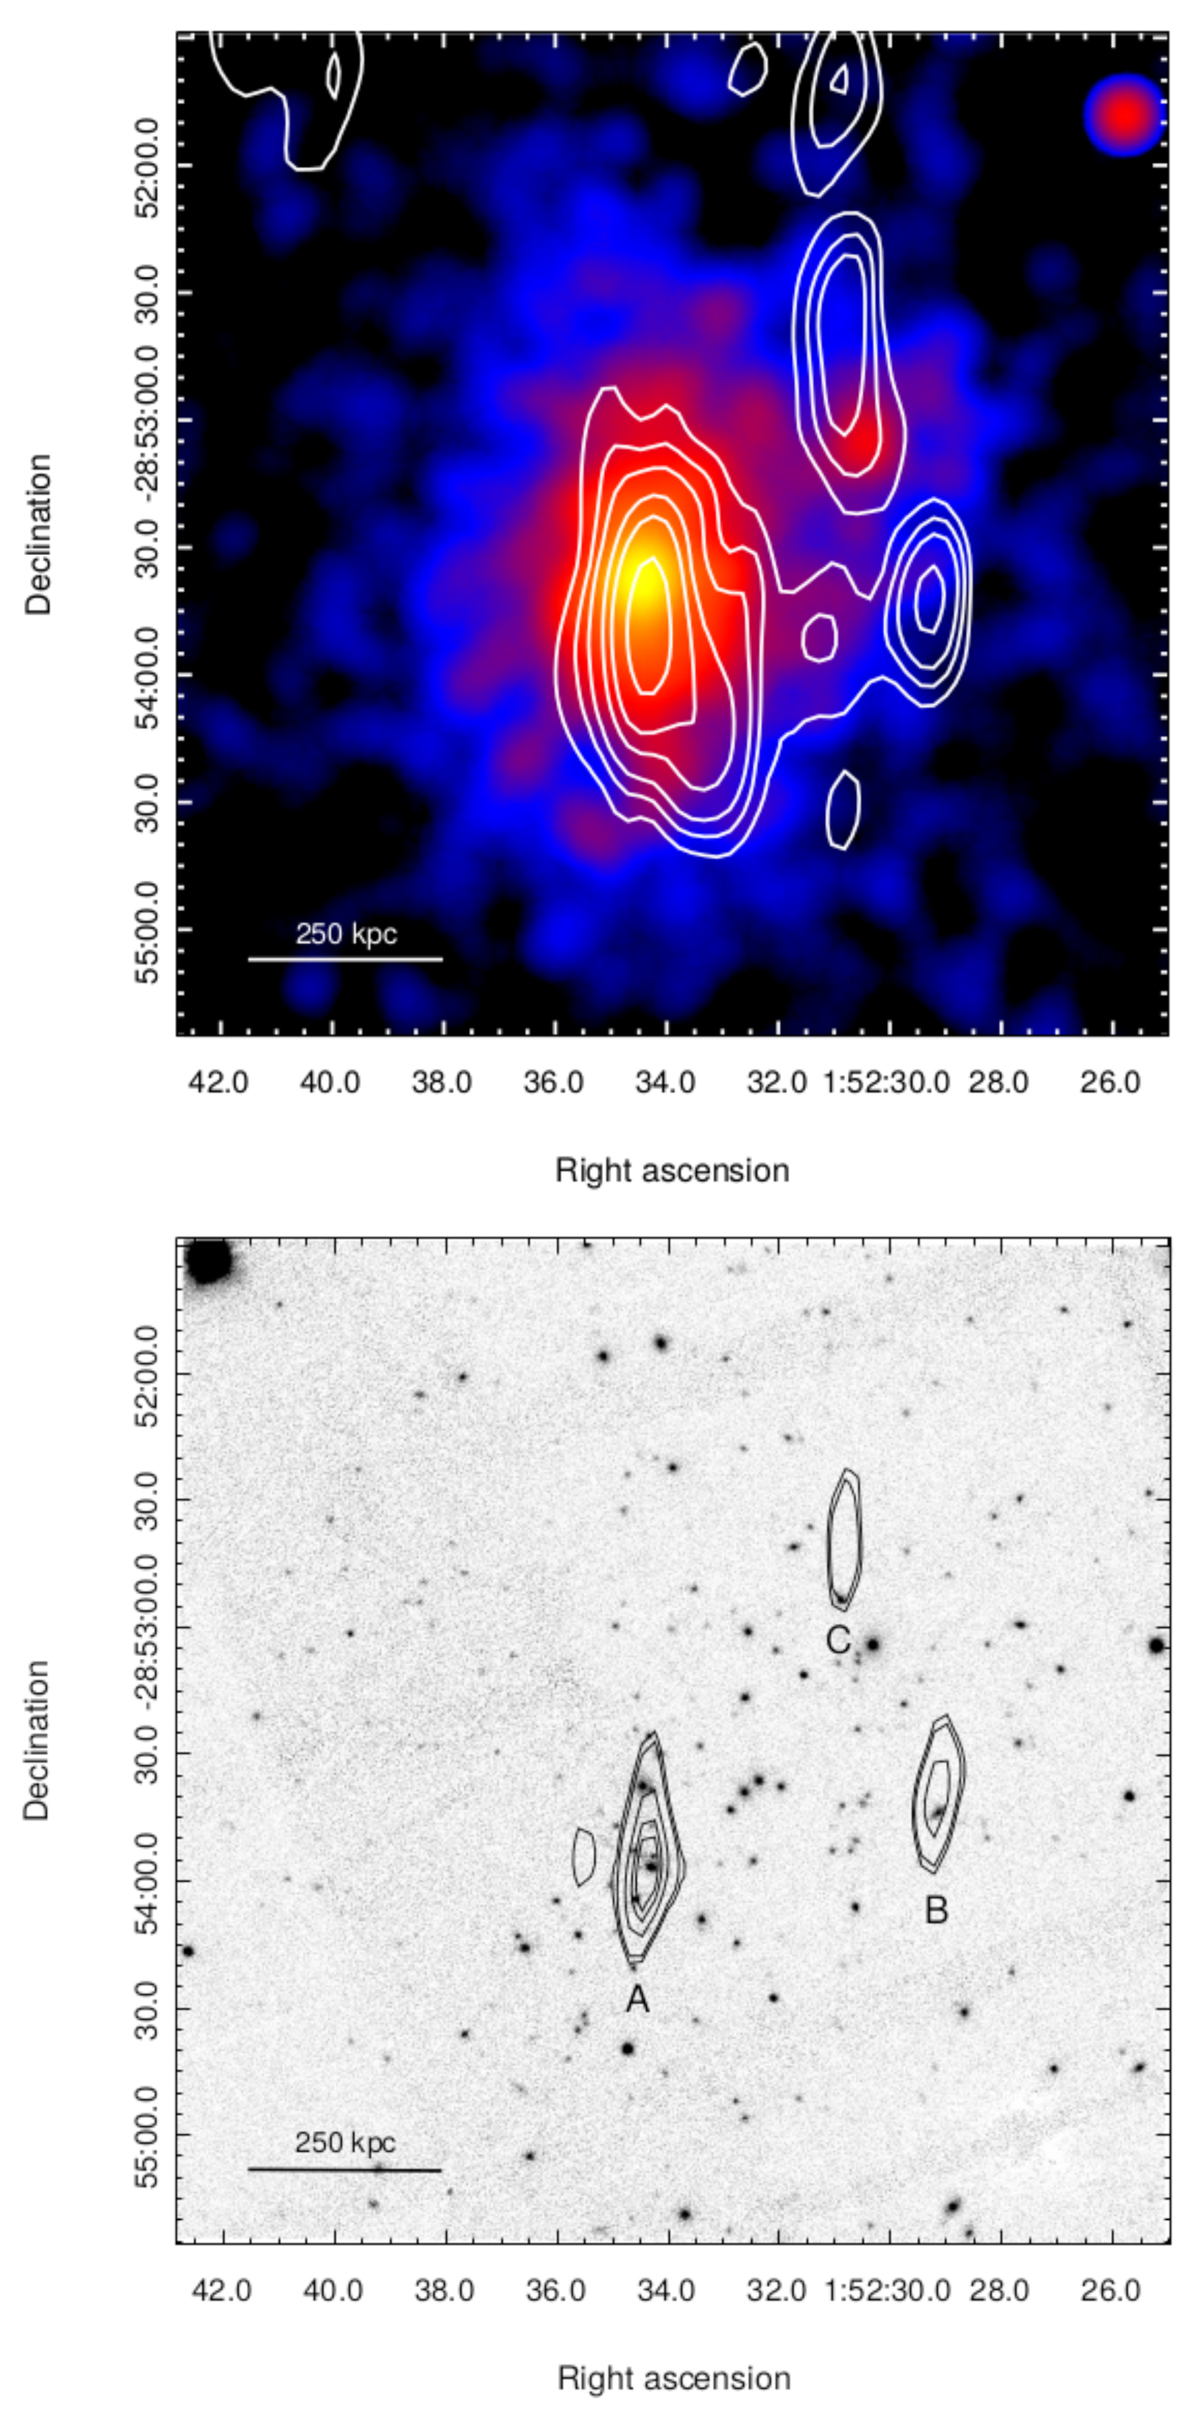
Top panel: total-intensity radio contours (C+D array) of MACS J0152.5−2852 at 1.5 GHz overlaid on the Chandra X-ray image. The radio image has an FWHM of 36.2″ × 12.3″ (PA = − 6°). Contour levels are at (3, 6, 9, 12, 24, 48) × σ with rms noise σ = 0.034 mJy per beam. Bottom panel: C-array contours using only the longest baselines. The beam is 26.3″ × 6.9″ (PA = − 5.5°). Contour levels are at (3.6, 4, 8, 9, 10) × σ with rms noise σ = 0.03 mJy per beam. The radio image is superposed on the optical image. Point sources are labeled as A, B, C.
Current usage metrics show cumulative count of Article Views (full-text article views including HTML views, PDF and ePub downloads, according to the available data) and Abstracts Views on Vision4Press platform.
Data correspond to usage on the plateform after 2015. The current usage metrics is available 48-96 hours after online publication and is updated daily on week days.
Initial download of the metrics may take a while.