Free Access
Fig. 12.
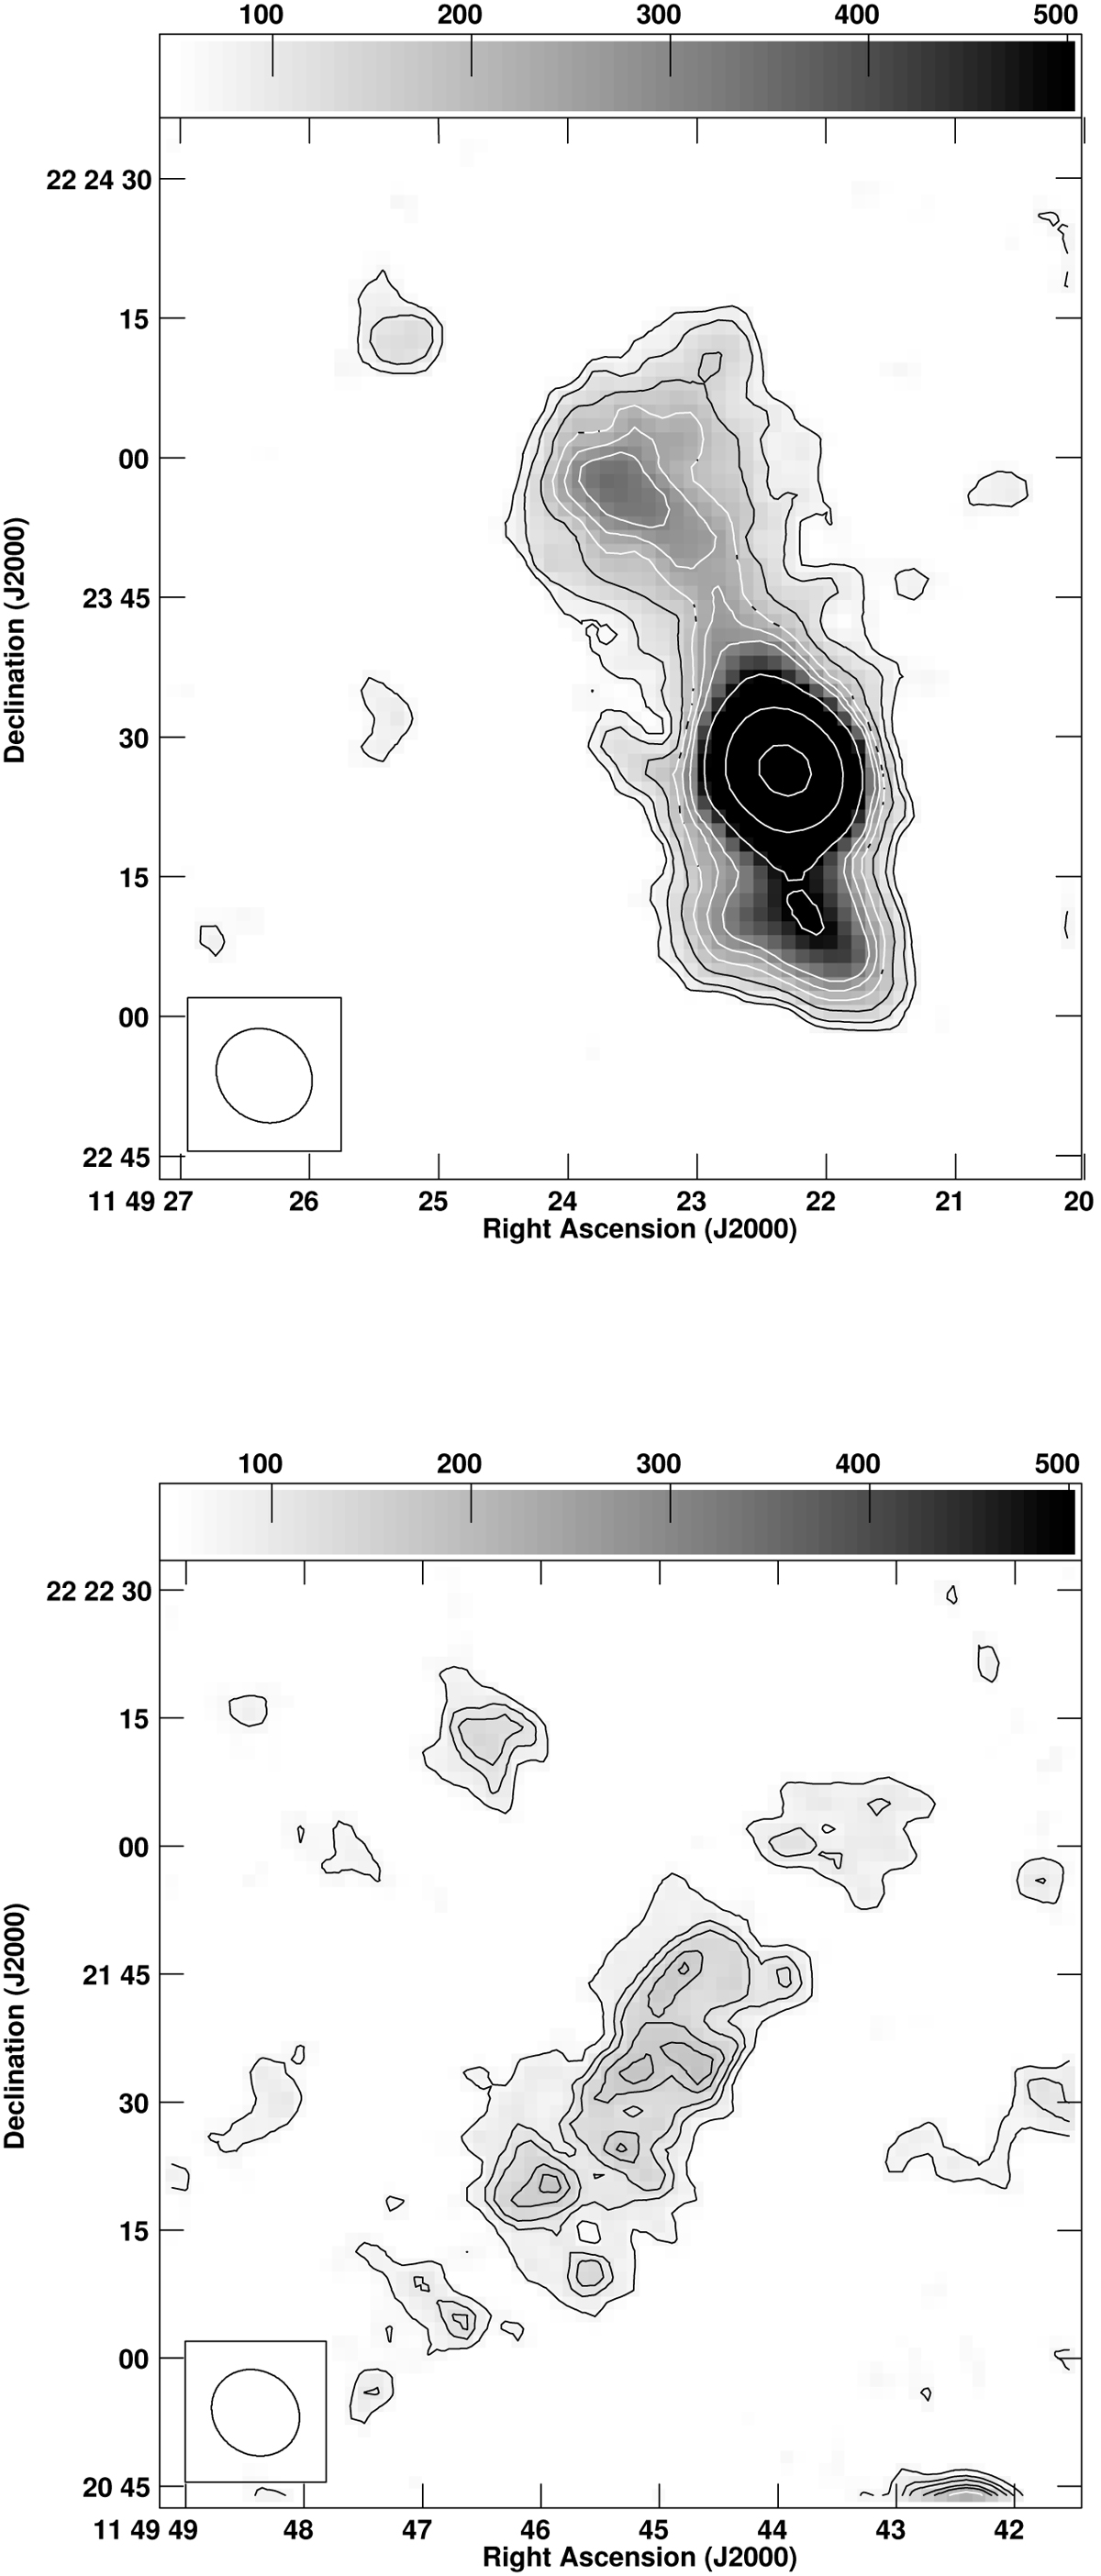
Top panel: radio image (1.53 GHz) of the W source in MACS J1149.5+2223 that we classify as a radio galaxy. Bottom panel: radio image of the SE source that we classify as a filament. Contours, resolution and noise level as in Fig. 11.
Current usage metrics show cumulative count of Article Views (full-text article views including HTML views, PDF and ePub downloads, according to the available data) and Abstracts Views on Vision4Press platform.
Data correspond to usage on the plateform after 2015. The current usage metrics is available 48-96 hours after online publication and is updated daily on week days.
Initial download of the metrics may take a while.