Fig. 6.
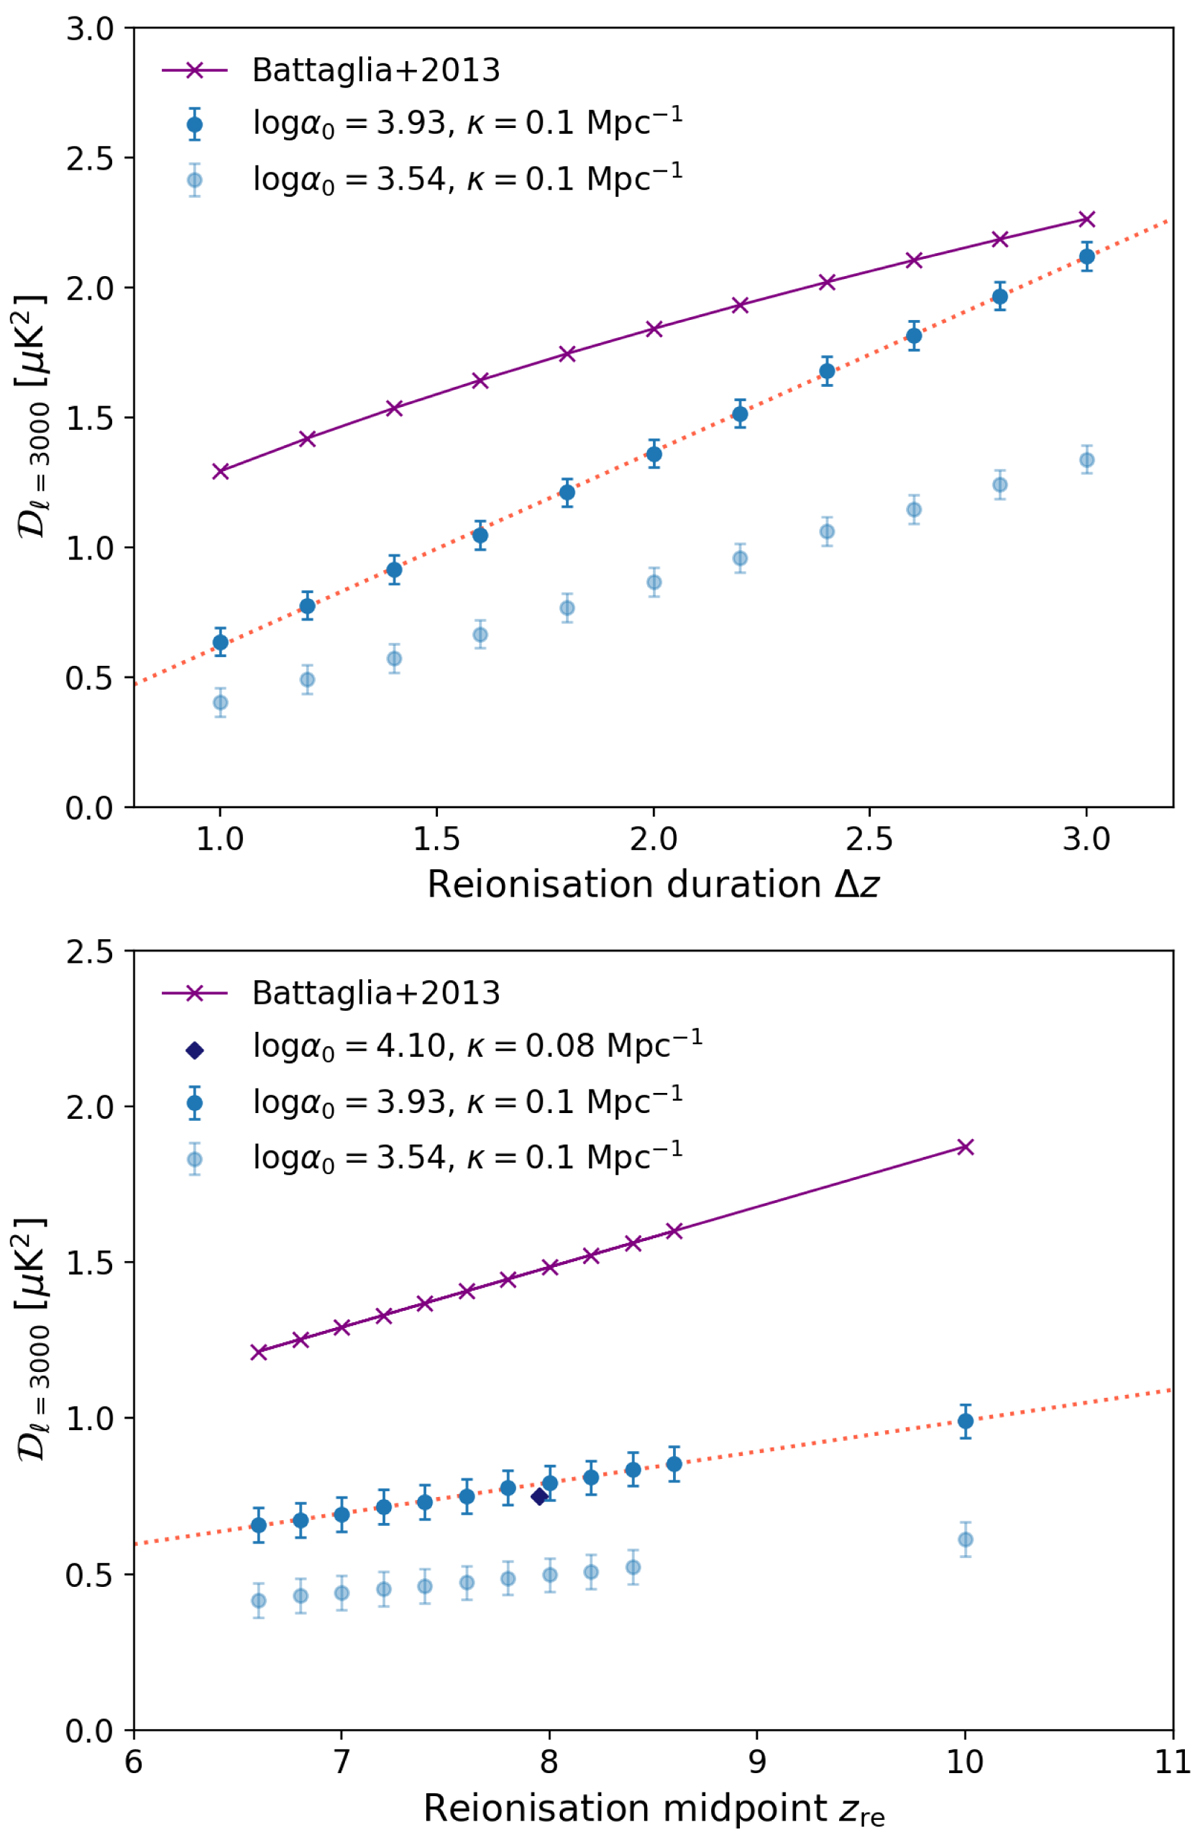
Evolution of the amplitude of the patchy power spectrum at ℓ = 3000, 𝒟3000 with the reionisation duration (upper panel) and the reionisation midpoint zre (lower panel), for different values of our parameters. Error bars correspond to the dispersion of kSZ amplitude at ℓ = 3000 (68% confidence level) propagated from errors on the fit parameters. The diamond data point corresponds to a seventh simulation, with reionisation happening earlier. In both panels, results are compared to those of Battaglia et al. (2013), rescaled to our cosmology.
Current usage metrics show cumulative count of Article Views (full-text article views including HTML views, PDF and ePub downloads, according to the available data) and Abstracts Views on Vision4Press platform.
Data correspond to usage on the plateform after 2015. The current usage metrics is available 48-96 hours after online publication and is updated daily on week days.
Initial download of the metrics may take a while.