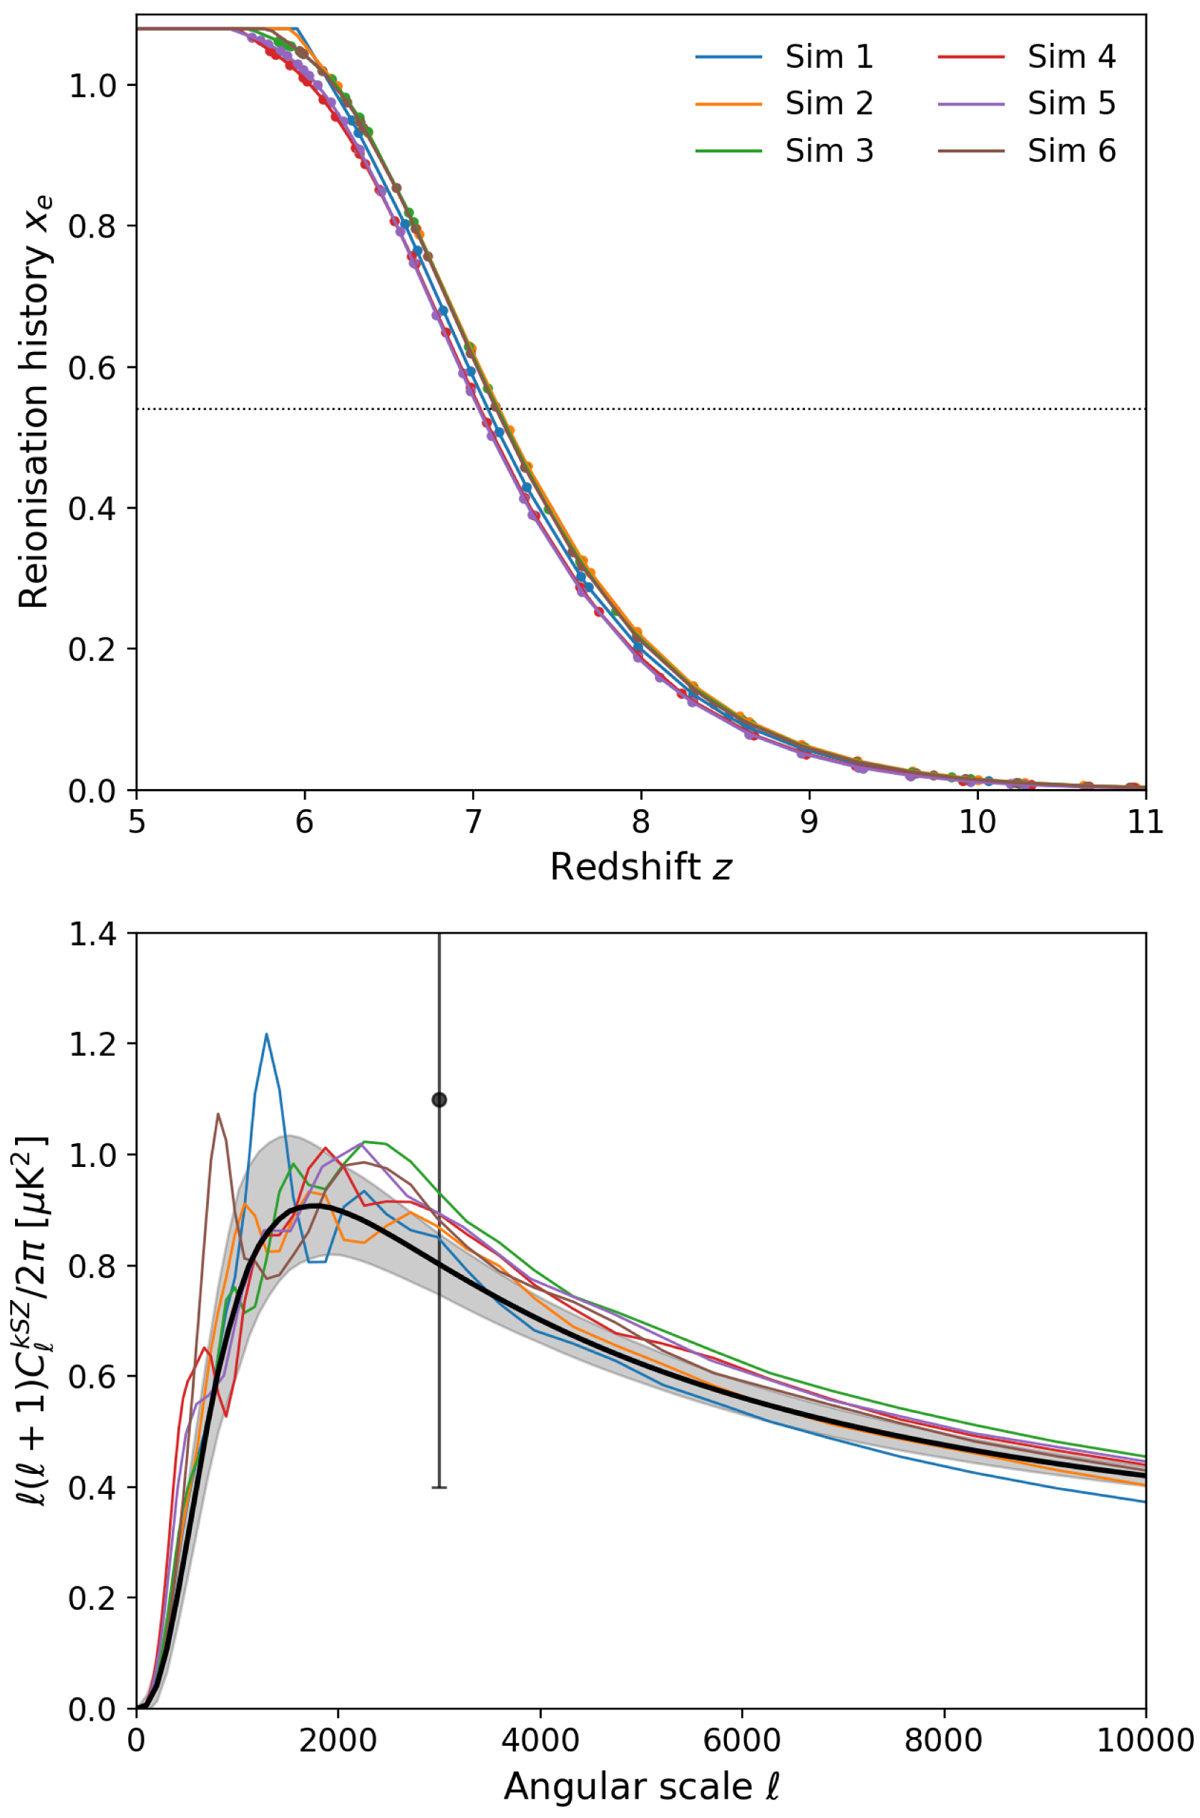
Fig. 5.

Results for our six simulations. Upper panel: global reionisation histories, for H II and He II. The dotted horizontal line marks the reionisation midpoint zre. Lower panel: angular kSZ power spectrum after fitting Eq. (15) to the Pee(k, z) data points from our six simulations (thick solid line) compared to the spectra obtained when interpolating the data points for each simulation (thin solid lines). Error bars correspond to the propagation of the 68% confidence interval on the fit parameters. The data point corresponds to constraints from Reichardt et al. (2020) at ℓ = 3000.
Current usage metrics show cumulative count of Article Views (full-text article views including HTML views, PDF and ePub downloads, according to the available data) and Abstracts Views on Vision4Press platform.
Data correspond to usage on the plateform after 2015. The current usage metrics is available 48-96 hours after online publication and is updated daily on week days.
Initial download of the metrics may take a while.


