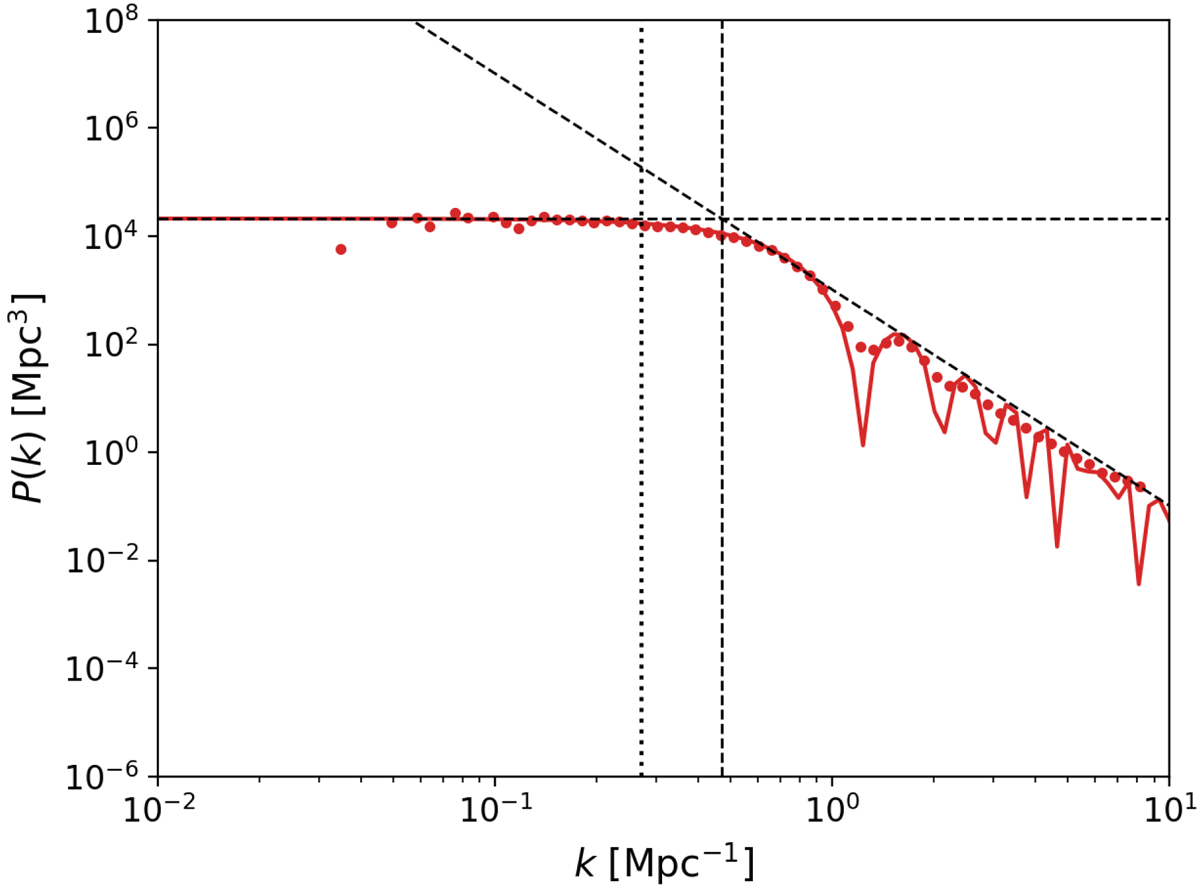
Fig. 1.

Free electrons density contrast power spectrum for a box filled with enough bubbles of radius R = 15 px = 5.5 Mpc to reach a filling fraction f = 1%. Points are results of a numerical computation of the power spectrum, compared to the theoretical model (solid line). The dotted vertical line corresponds to k = 1/R, the dashed vertical line to 91/4/R, the dashed horizontal line to 4/3πR3/f and the tilted dashed line has slope k−4.
Current usage metrics show cumulative count of Article Views (full-text article views including HTML views, PDF and ePub downloads, according to the available data) and Abstracts Views on Vision4Press platform.
Data correspond to usage on the plateform after 2015. The current usage metrics is available 48-96 hours after online publication and is updated daily on week days.
Initial download of the metrics may take a while.


