Free Access
Fig. A.6.
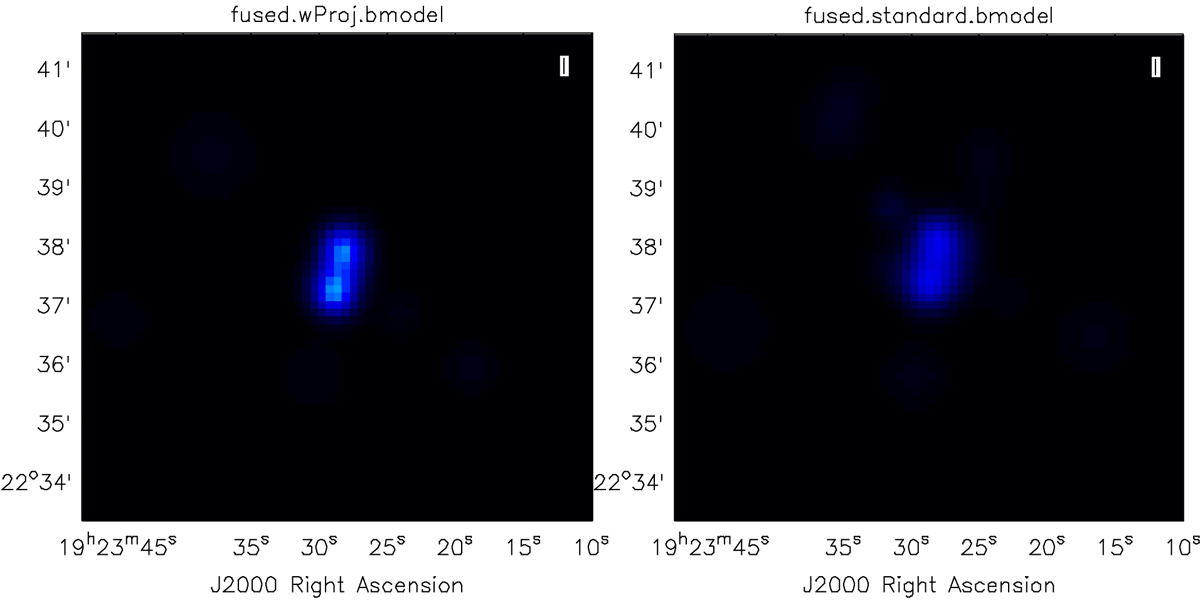
Tightly separated compact sources from the top of the imaging region in Fig. A.5. Left: reconstructed by our imager and peak flux of 1.979 mJy. Right: reconstructed by only our adaptive-scale model construct method included in our imager, but without the w-term correction and peak flux of 1.435 mJy.
Current usage metrics show cumulative count of Article Views (full-text article views including HTML views, PDF and ePub downloads, according to the available data) and Abstracts Views on Vision4Press platform.
Data correspond to usage on the plateform after 2015. The current usage metrics is available 48-96 hours after online publication and is updated daily on week days.
Initial download of the metrics may take a while.