Free Access
Fig. A.1.
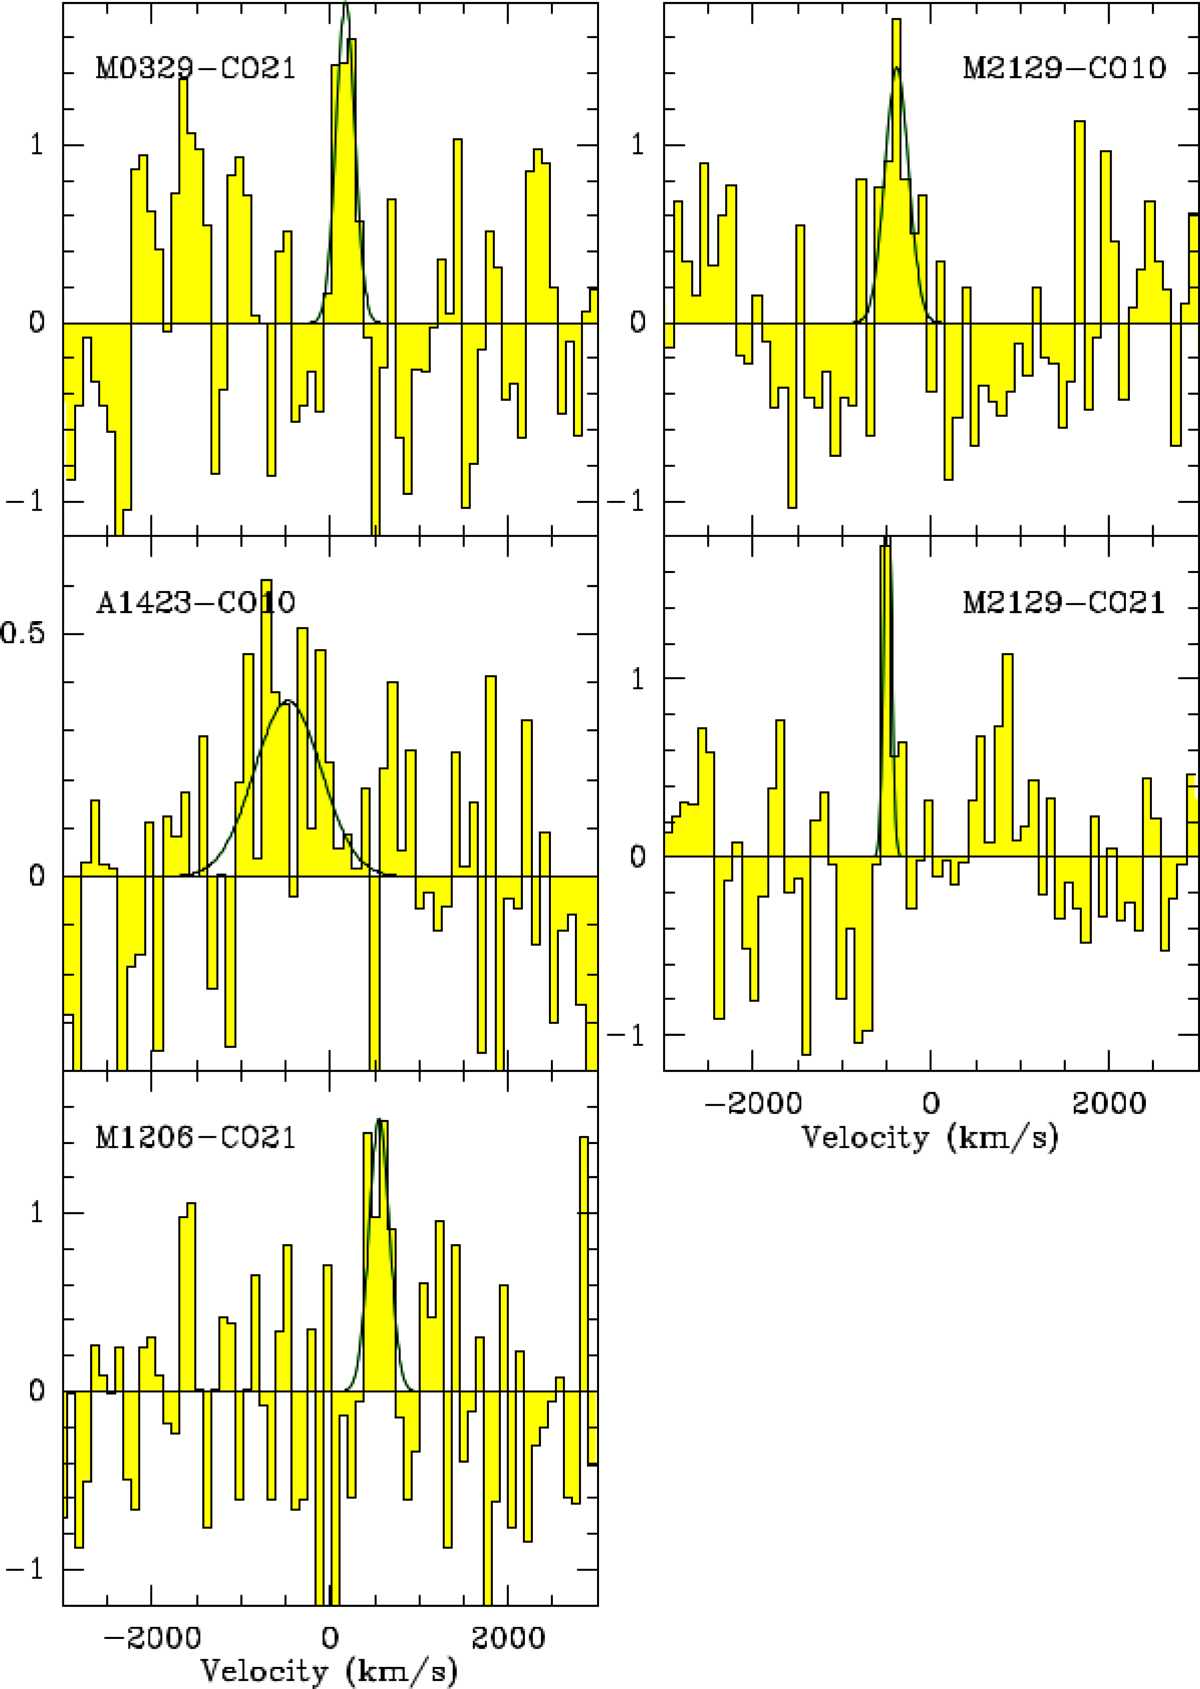
Baseline-subtracted spectra for the BCGs with tentative CO detections, obtained with the IRAM 30 m. In all panels the solid line shows the Gaussian best fit. In each panel, the x-axis shows the relative velocity with respect to the BCG redshift, as reported in Table 1, while in the y-axis Tmb is shown in units of mK.
Current usage metrics show cumulative count of Article Views (full-text article views including HTML views, PDF and ePub downloads, according to the available data) and Abstracts Views on Vision4Press platform.
Data correspond to usage on the plateform after 2015. The current usage metrics is available 48-96 hours after online publication and is updated daily on week days.
Initial download of the metrics may take a while.