Free Access
Fig. 6.
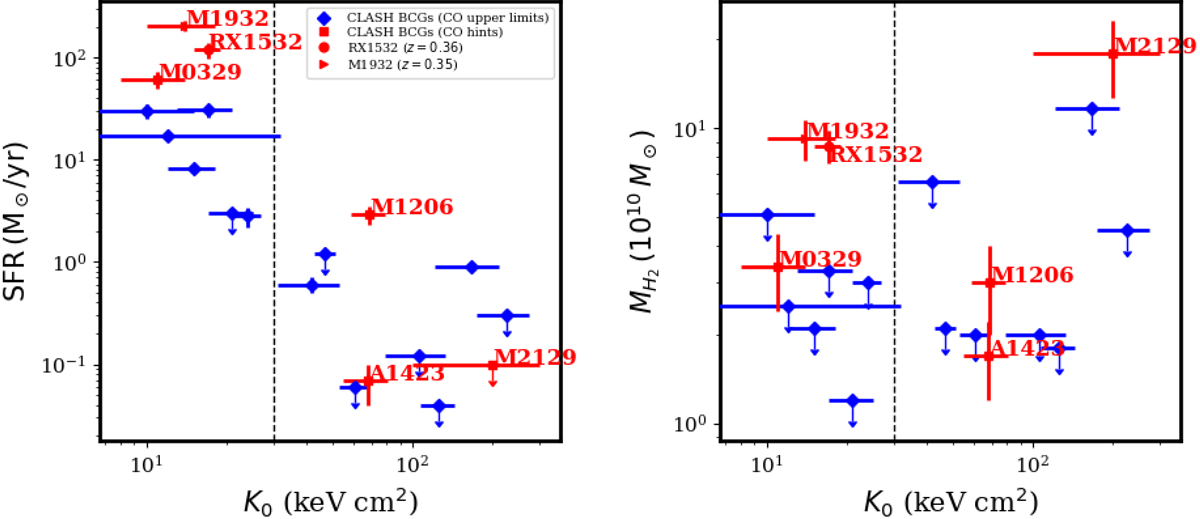
SFR (left) and molecular gas mass (right) vs. core entropy for CLASH BCGs with CO observations from our IRAM 30 m campaign (this work), as well as for M1932, with ALMA observations by Fogarty et al. (2019). The vertical dashed line is located at K0 = 30 keV cm2.
Current usage metrics show cumulative count of Article Views (full-text article views including HTML views, PDF and ePub downloads, according to the available data) and Abstracts Views on Vision4Press platform.
Data correspond to usage on the plateform after 2015. The current usage metrics is available 48-96 hours after online publication and is updated daily on week days.
Initial download of the metrics may take a while.