Fig. 4.
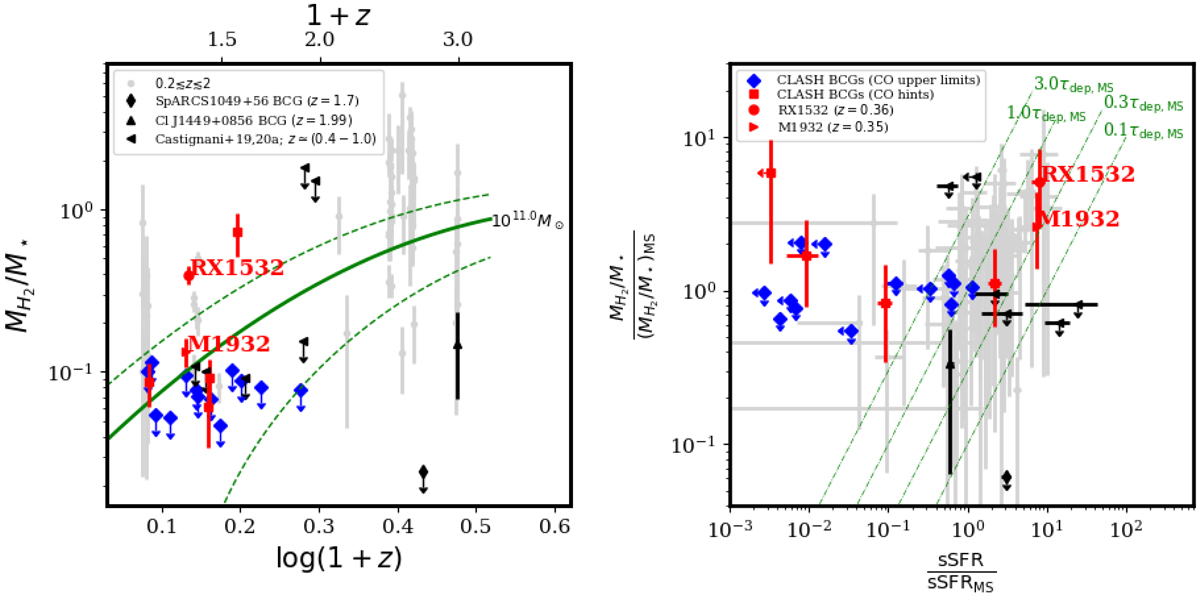
Molecular gas properties of distant BCGs and cluster galaxies observed in CO. Left: evolution of the molecular gas-to-stellar mass ratio as a function of the redshift for cluster galaxies at 0.2 ≲ z ≲ 2 observed in CO. The solid green curve is the scaling relation found by Tacconi et al. (2018) for field galaxies in the MS and with log(M⋆/M⊙) = 11, which corresponds to the median stellar mass of all sources in the plot. The green dashed lines show the statistical 1σ uncertainties in the model. Right: molecular gas-to-stellar mass ratio vs. the specific SFR for the cluster galaxies in our sample, both normalized to the corresponding MS values using the relations for the ratio and the SFR by Tacconi et al. (2018) and Speagle et al. (2014), respectively. The dot-dashed green lines show different depletion times, in units of the depletion time at the MS.
Current usage metrics show cumulative count of Article Views (full-text article views including HTML views, PDF and ePub downloads, according to the available data) and Abstracts Views on Vision4Press platform.
Data correspond to usage on the plateform after 2015. The current usage metrics is available 48-96 hours after online publication and is updated daily on week days.
Initial download of the metrics may take a while.