Fig. 3.
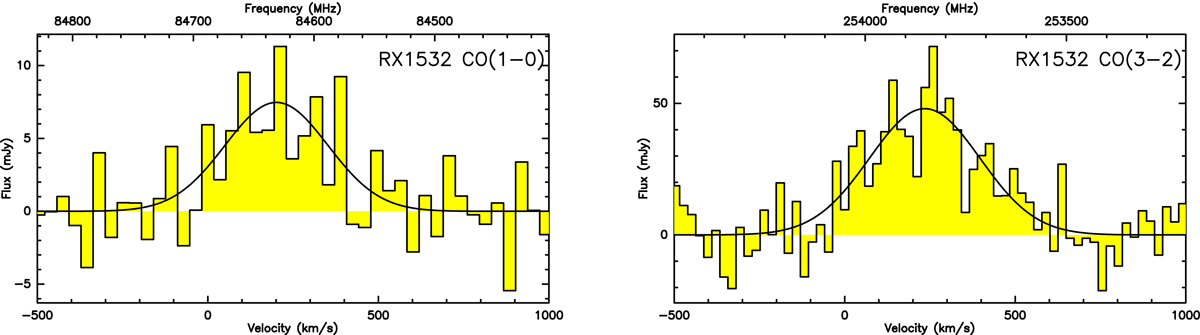
CO(1→0) and CO(3→2) baseline-subtracted spectra of the RX1532 BCG, obtained with the IRAM 30 m. In both panels, the solid line shows the Gaussian best fit. In both panels the flux (y-axis) is plotted against the relative velocity with respect to the BCG redshift, as in Table 1 (bottom x-axis) and the observer frame frequency (top x-axis).
Current usage metrics show cumulative count of Article Views (full-text article views including HTML views, PDF and ePub downloads, according to the available data) and Abstracts Views on Vision4Press platform.
Data correspond to usage on the plateform after 2015. The current usage metrics is available 48-96 hours after online publication and is updated daily on week days.
Initial download of the metrics may take a while.