Fig. 2.
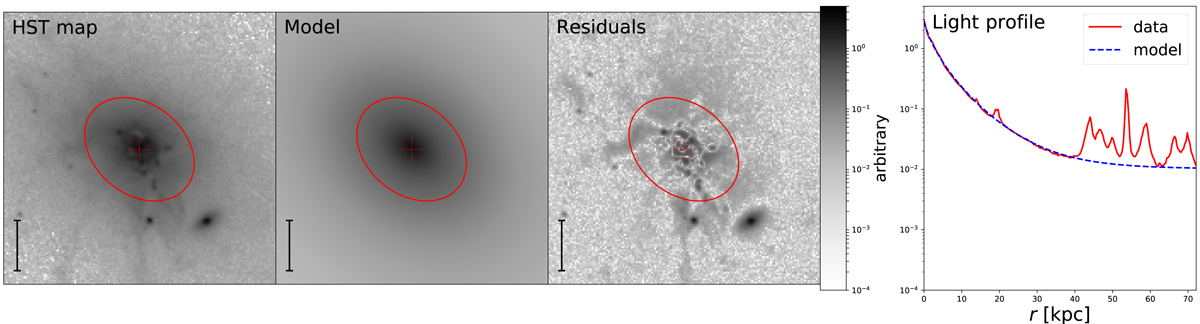
Morphological analysis of RX1532. From left to right: HST ACS image (F814W filter), best-fit single Sérsic model, residuals, and averaged radial light profile with the associated model. The red ellipse and the red cross in the images show the location of the half-light radius and that of the BCG, respectively. The vertical segment at the bottom left of each image has a size of 2 arcsec (i.e.,10 kpc).
Current usage metrics show cumulative count of Article Views (full-text article views including HTML views, PDF and ePub downloads, according to the available data) and Abstracts Views on Vision4Press platform.
Data correspond to usage on the plateform after 2015. The current usage metrics is available 48-96 hours after online publication and is updated daily on week days.
Initial download of the metrics may take a while.