Fig. 5
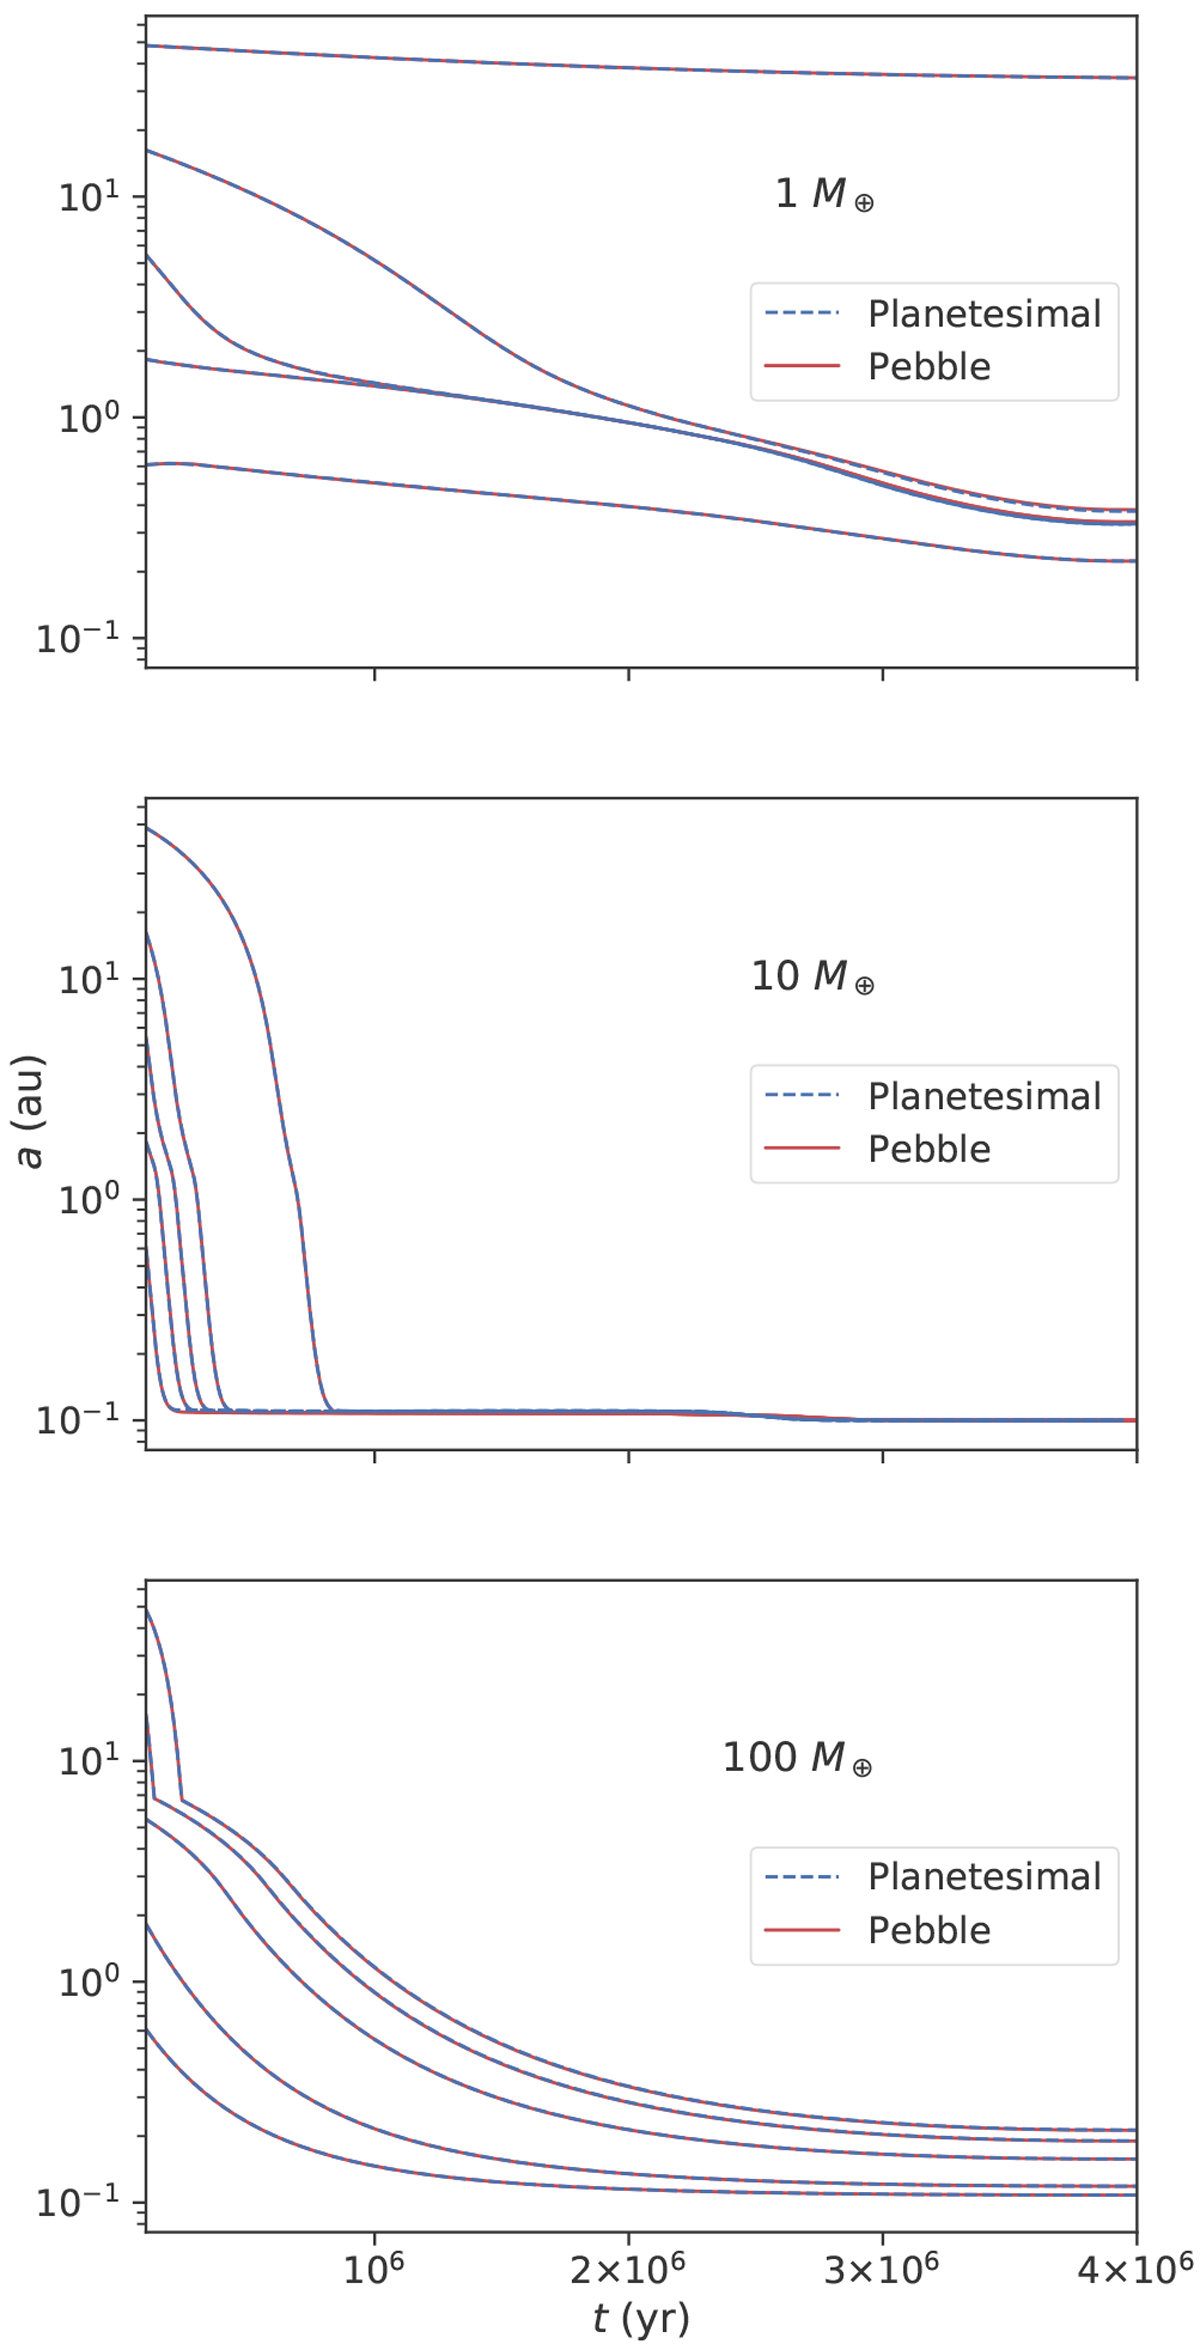
Migration of three different fixed-mass planets for different locations (0.6, 1.8, 5.5, 17, and 50 AU). Top plot: migration of a 1 M⊕ planet, middle plot: 10 M⊕ planet, and bottom plot: 100 M⊕ planet. The solid red lines give the outcomes of the pebble accretion code and the dashed blue lines represent the results of the planetesimal accretion code.
Current usage metrics show cumulative count of Article Views (full-text article views including HTML views, PDF and ePub downloads, according to the available data) and Abstracts Views on Vision4Press platform.
Data correspond to usage on the plateform after 2015. The current usage metrics is available 48-96 hours after online publication and is updated daily on week days.
Initial download of the metrics may take a while.