Free Access
Fig. 2
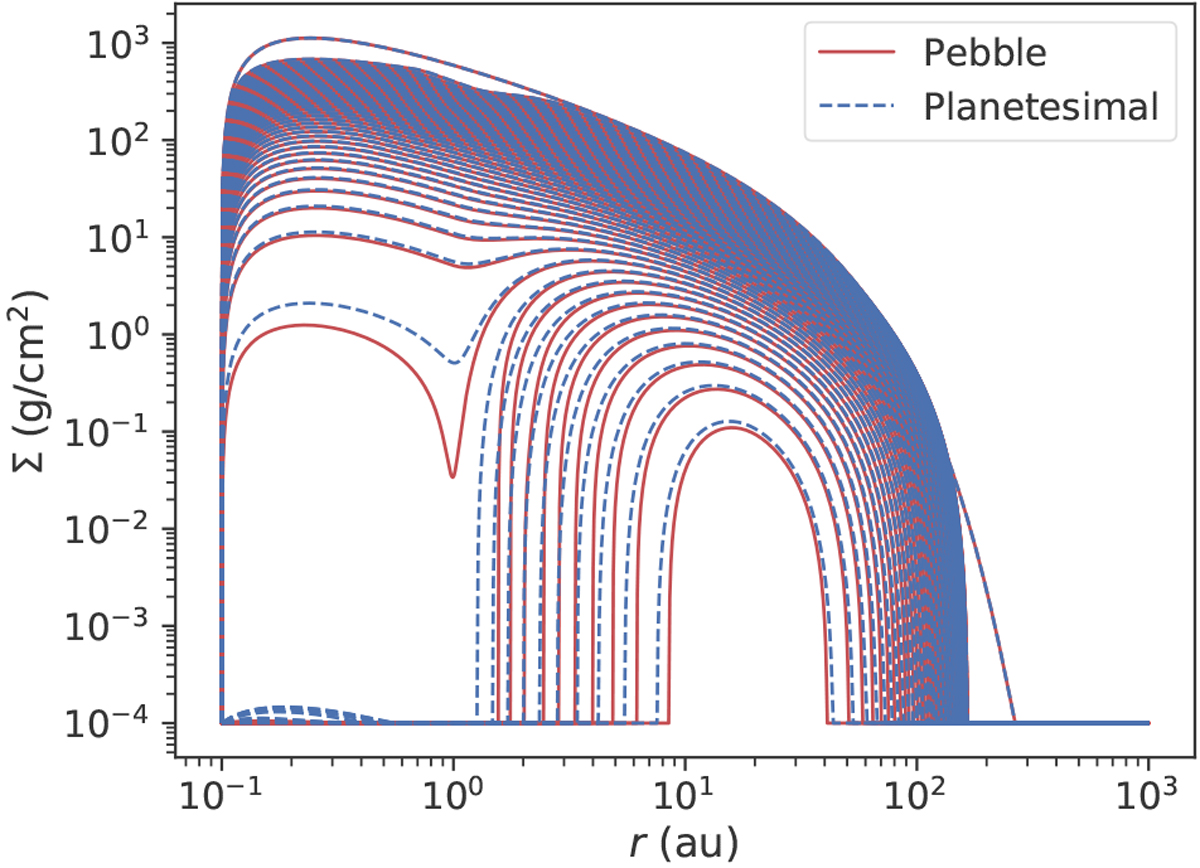
Surface density comparison between the two codes. The red lines show the result using the pebble accretion code and the dotted blue lines give the outcome using the planetesimal accretion code.The disc evolves for 4.99 Myr, and each line corresponds to the output each 100 000 yr.
Current usage metrics show cumulative count of Article Views (full-text article views including HTML views, PDF and ePub downloads, according to the available data) and Abstracts Views on Vision4Press platform.
Data correspond to usage on the plateform after 2015. The current usage metrics is available 48-96 hours after online publication and is updated daily on week days.
Initial download of the metrics may take a while.