Fig. 14
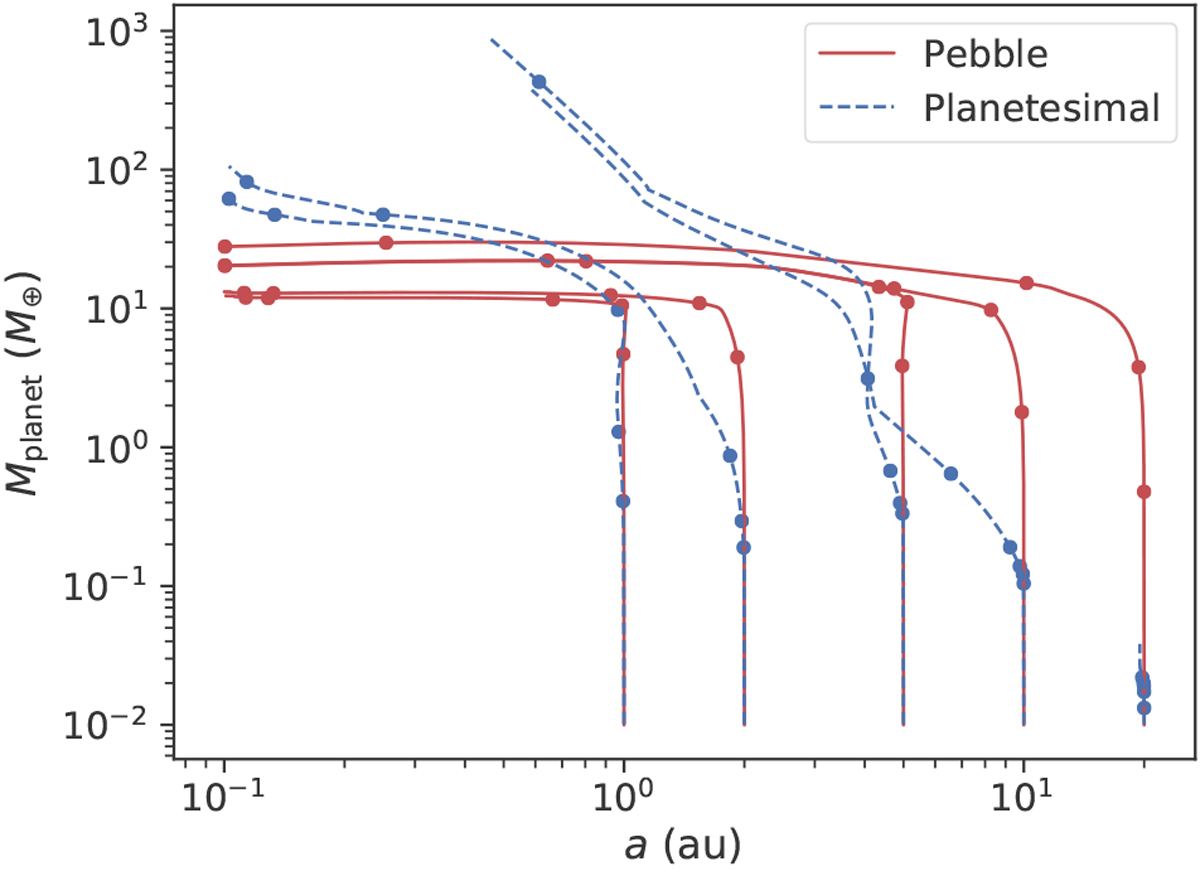
Growth tracks of planets in the same disc for a starting time of tini = 0 Myr. The initial locations are 1, 2, 5, 10, and 20 AU. The red solid lines give the pebble model outputs, while the blue dashed lines represent the planetesimal results. The dots indicates the growth evolution after 10 000 yr, 30 000 yr, 0.1 Myr, 0.3 Myr, and 1 Myr. The disc lifetime for this simulation is 2 Myr.
Current usage metrics show cumulative count of Article Views (full-text article views including HTML views, PDF and ePub downloads, according to the available data) and Abstracts Views on Vision4Press platform.
Data correspond to usage on the plateform after 2015. The current usage metrics is available 48-96 hours after online publication and is updated daily on week days.
Initial download of the metrics may take a while.