Fig. 13
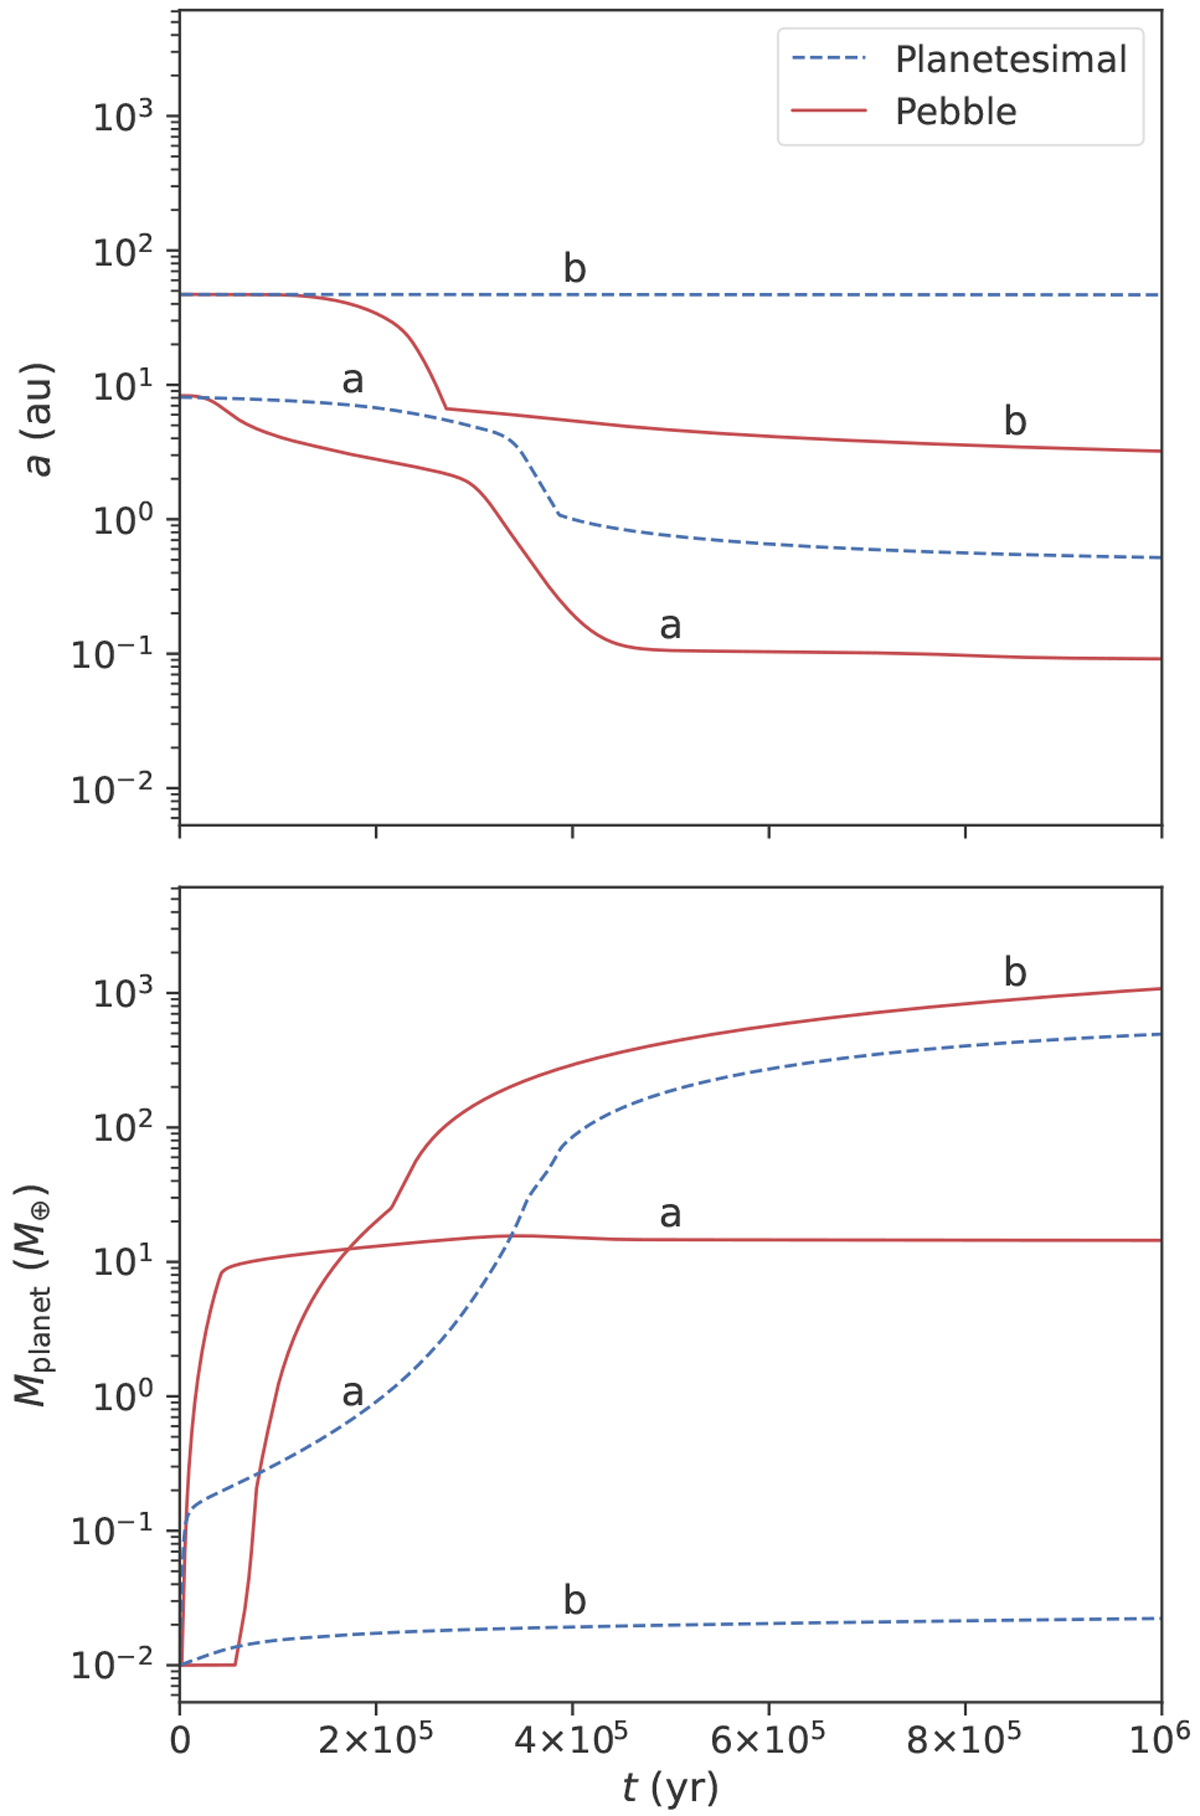
Growth tracks and migration tracks as a function of time for two disc cases. In disc a the planetesimal accretion model forms a giant planet, while in disc b the pebble accretion model does. Upper plot: migration of the planets with time and bottom plot: mass of the planets with time. The red lines represent the pebble model results and the blue lines the planetesimal model results.
Current usage metrics show cumulative count of Article Views (full-text article views including HTML views, PDF and ePub downloads, according to the available data) and Abstracts Views on Vision4Press platform.
Data correspond to usage on the plateform after 2015. The current usage metrics is available 48-96 hours after online publication and is updated daily on week days.
Initial download of the metrics may take a while.