Free Access
Fig. 12
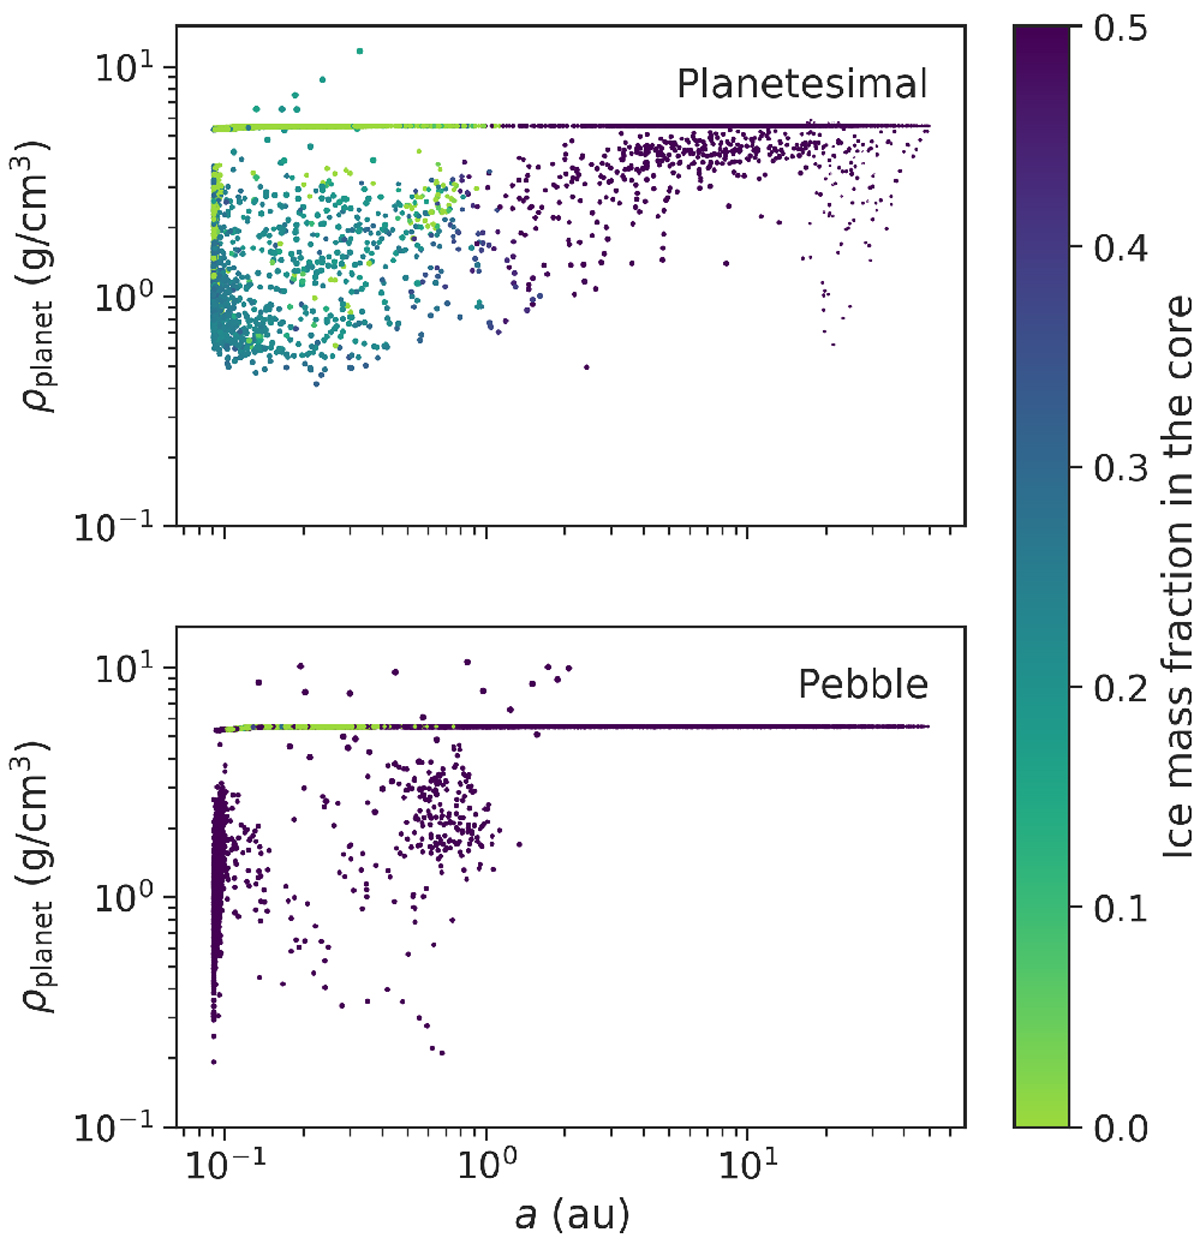
Density of the planet as function of the final location of the planets for the ε = 0.9 case and starting time tini = 0 Myr. The colour-coding expresses the ice mass fraction in the core. Upper panel: provides the results of the planetesimal accretion model and bottom panel: those of the pebble accretion model.
Current usage metrics show cumulative count of Article Views (full-text article views including HTML views, PDF and ePub downloads, according to the available data) and Abstracts Views on Vision4Press platform.
Data correspond to usage on the plateform after 2015. The current usage metrics is available 48-96 hours after online publication and is updated daily on week days.
Initial download of the metrics may take a while.