Fig. 23.
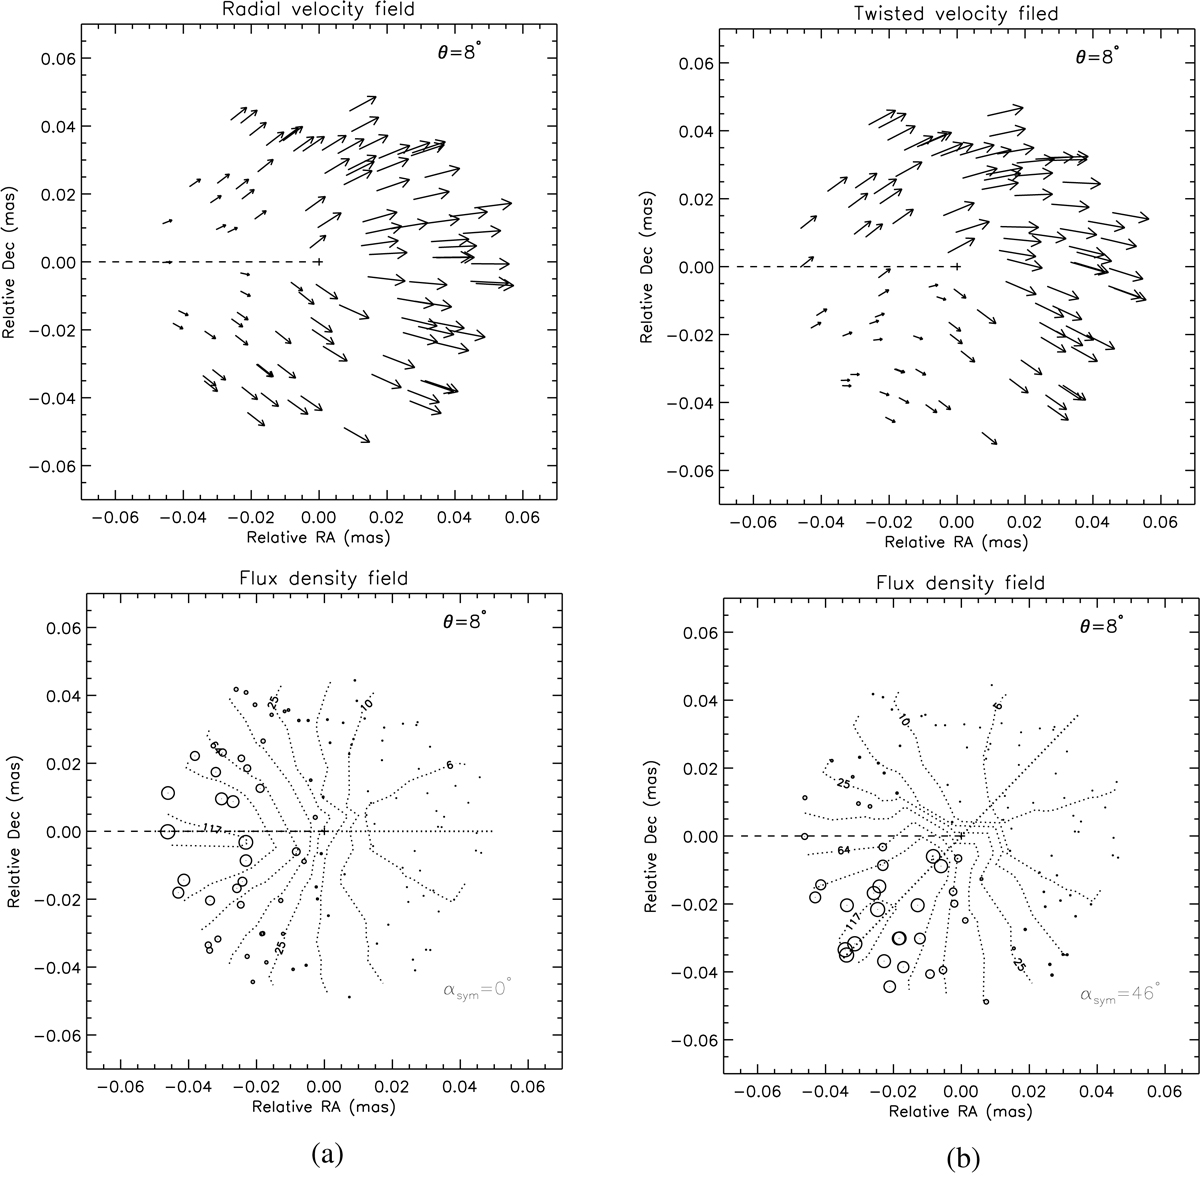
On-sky projection of the simulated velocity field and flux density distribution of C7 with the Lorentz factor γ = 10 and jet viewing angle θ = 8° in the case of (a) radial velocity filed (left panels) and (b) twisted velocity field (right panels). Radial and twisted velocity fields are the same as in Fig. 22. Median position of the scatter of C7 is marked by plus sign. Curved dotted lines represent the contour lines of the flux densities and thick dotted straight line denotes the symmetry axis of the scatter. Projection of the jet axis is shown by dashed line.
Current usage metrics show cumulative count of Article Views (full-text article views including HTML views, PDF and ePub downloads, according to the available data) and Abstracts Views on Vision4Press platform.
Data correspond to usage on the plateform after 2015. The current usage metrics is available 48-96 hours after online publication and is updated daily on week days.
Initial download of the metrics may take a while.