Fig. 15.
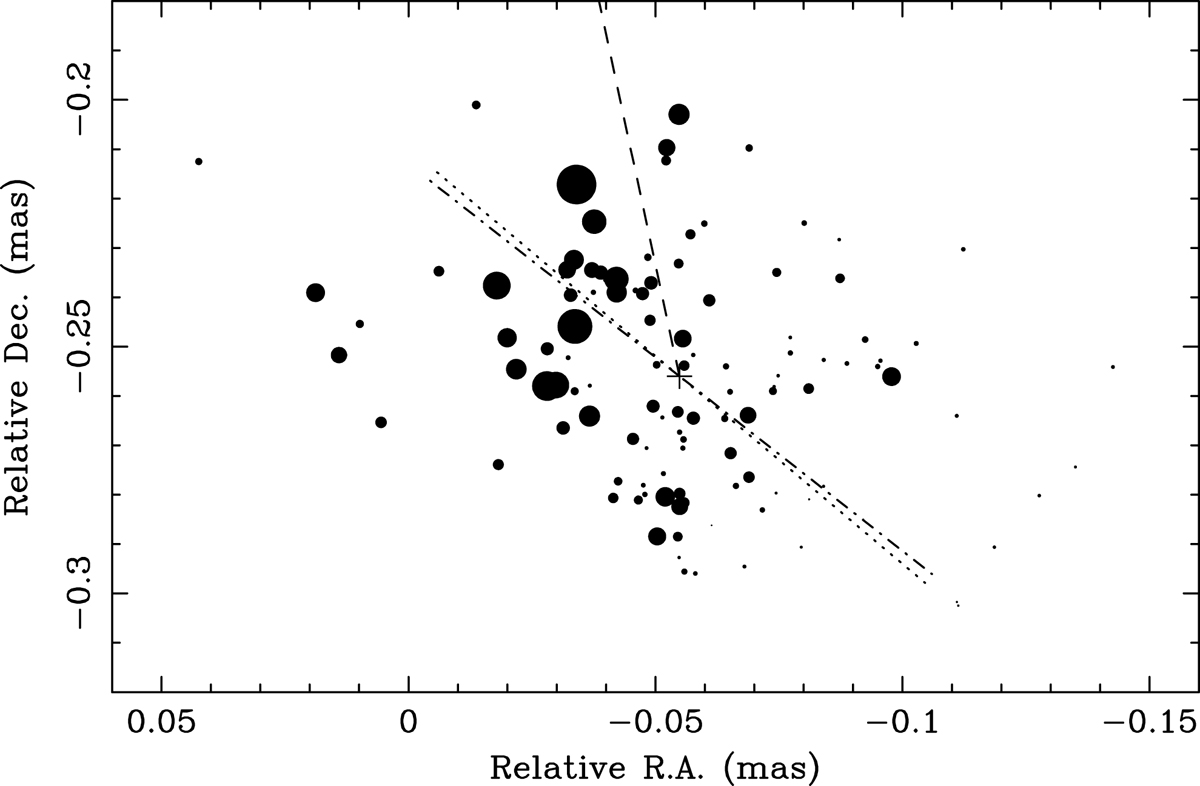
Distribution of flux density measurements of C7 on the sky. The sizes of the circles are proportional to the flux densities of C7, which are in the range from 0.17 Jy to 4.4 Jy. The median position of the scatter is marked by a plus sign. The dashed line connects the median position of C7 and the radio core. The axis of maximum beaming (PAmb = −122°) and symmetry axis (PAsym = −120°) are denoted by dotted line and dot-dashed line, respectively.
Current usage metrics show cumulative count of Article Views (full-text article views including HTML views, PDF and ePub downloads, according to the available data) and Abstracts Views on Vision4Press platform.
Data correspond to usage on the plateform after 2015. The current usage metrics is available 48-96 hours after online publication and is updated daily on week days.
Initial download of the metrics may take a while.