Fig. 12.
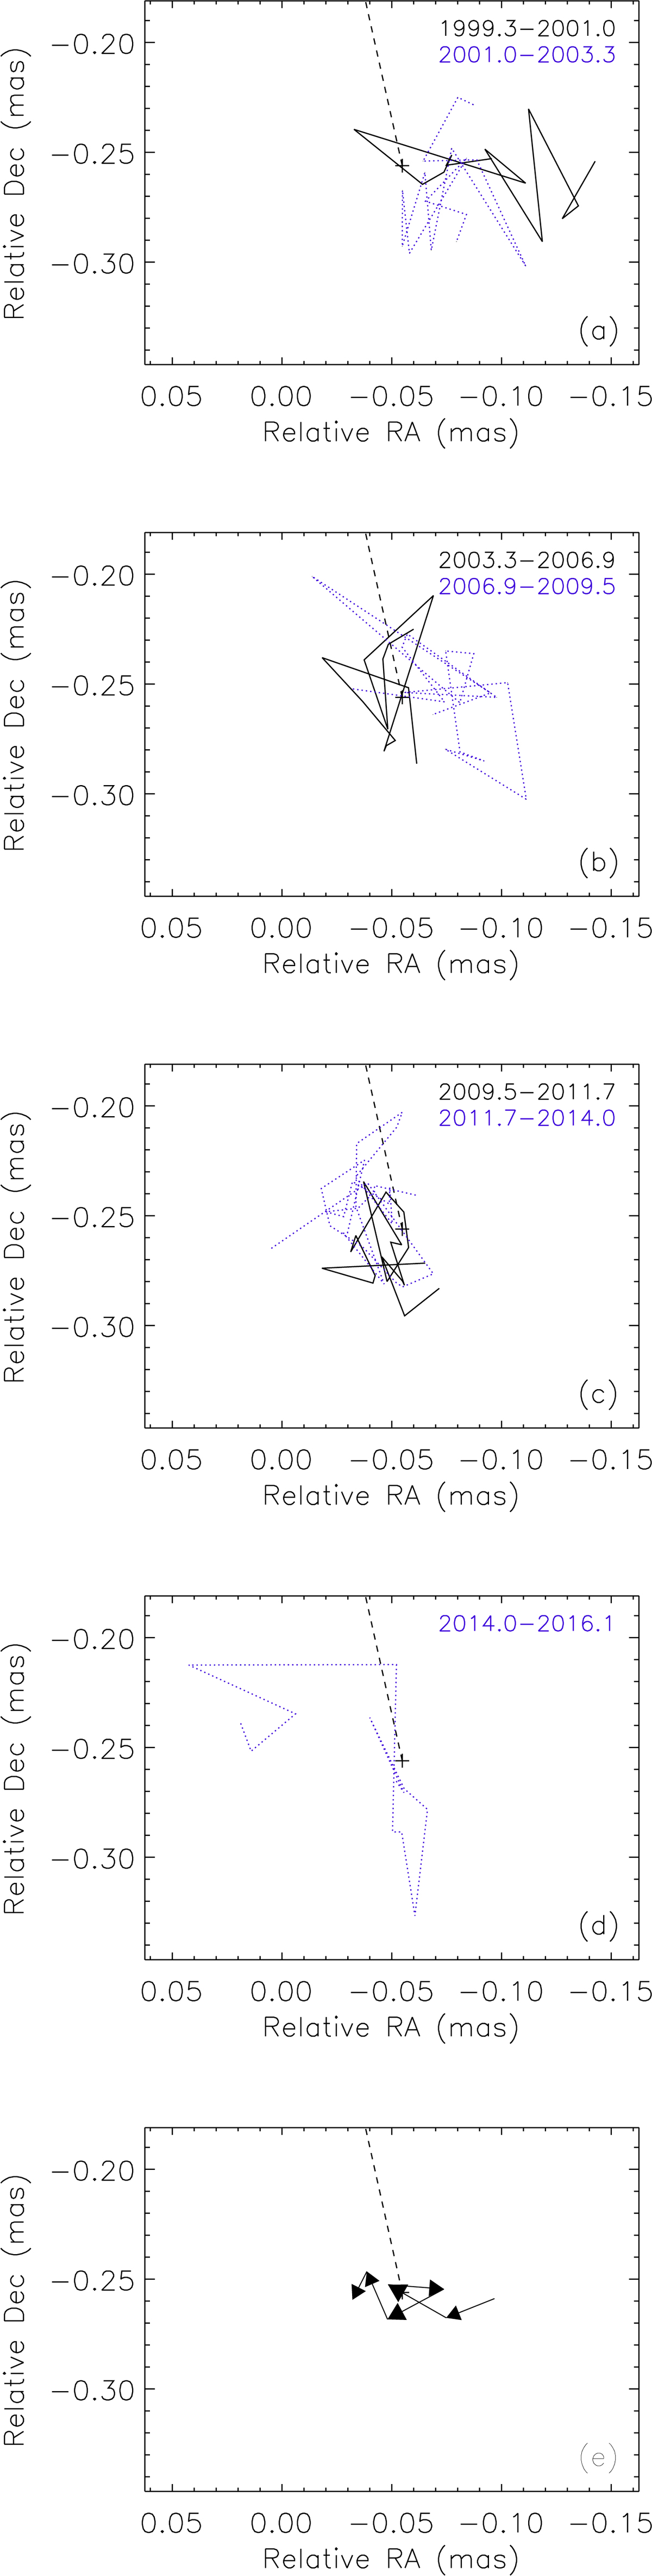
Apparent displacements of C7 are shown for seven time periods, 1999.37−2001 and 2001−2003.3 (panel a, full and dotted blue lines, respectively), 2003.3−2006.9 and 2006.9−2009.5 (b), 2009.5−2011.7 and 2011.7−2014 (c), and 2014−2016.06 (d). Trajectories smoothed over the seven time periods are shown in the panel e. Arrows indicate the direction of the smoothed motion of C7. The mean error of the lengths of six vectors is 0.008 mas.
Current usage metrics show cumulative count of Article Views (full-text article views including HTML views, PDF and ePub downloads, according to the available data) and Abstracts Views on Vision4Press platform.
Data correspond to usage on the plateform after 2015. The current usage metrics is available 48-96 hours after online publication and is updated daily on week days.
Initial download of the metrics may take a while.