Open Access
Fig. 4.
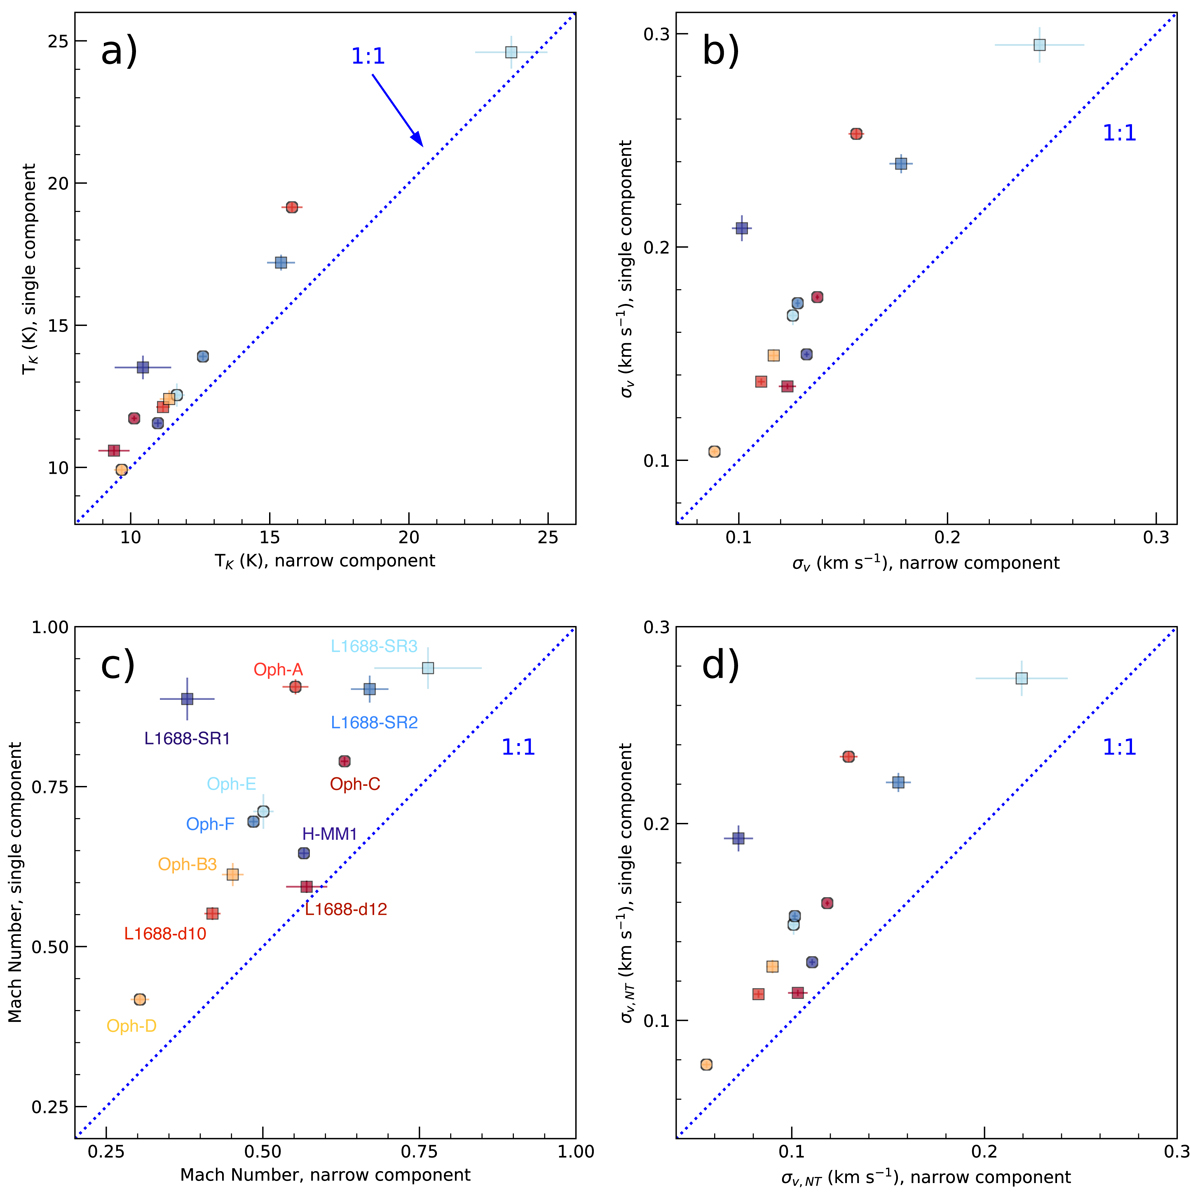
Kinetic temperature, velocity dispersion, Mach number and non-thermal dispersion in the cores, from single-component fits, and for the narrow component of a two-component fit, are shown in panels a–d, respectively. In the cases where the error bar is not visible, the error is smaller than the symbols.
Current usage metrics show cumulative count of Article Views (full-text article views including HTML views, PDF and ePub downloads, according to the available data) and Abstracts Views on Vision4Press platform.
Data correspond to usage on the plateform after 2015. The current usage metrics is available 48-96 hours after online publication and is updated daily on week days.
Initial download of the metrics may take a while.