Fig. 1.
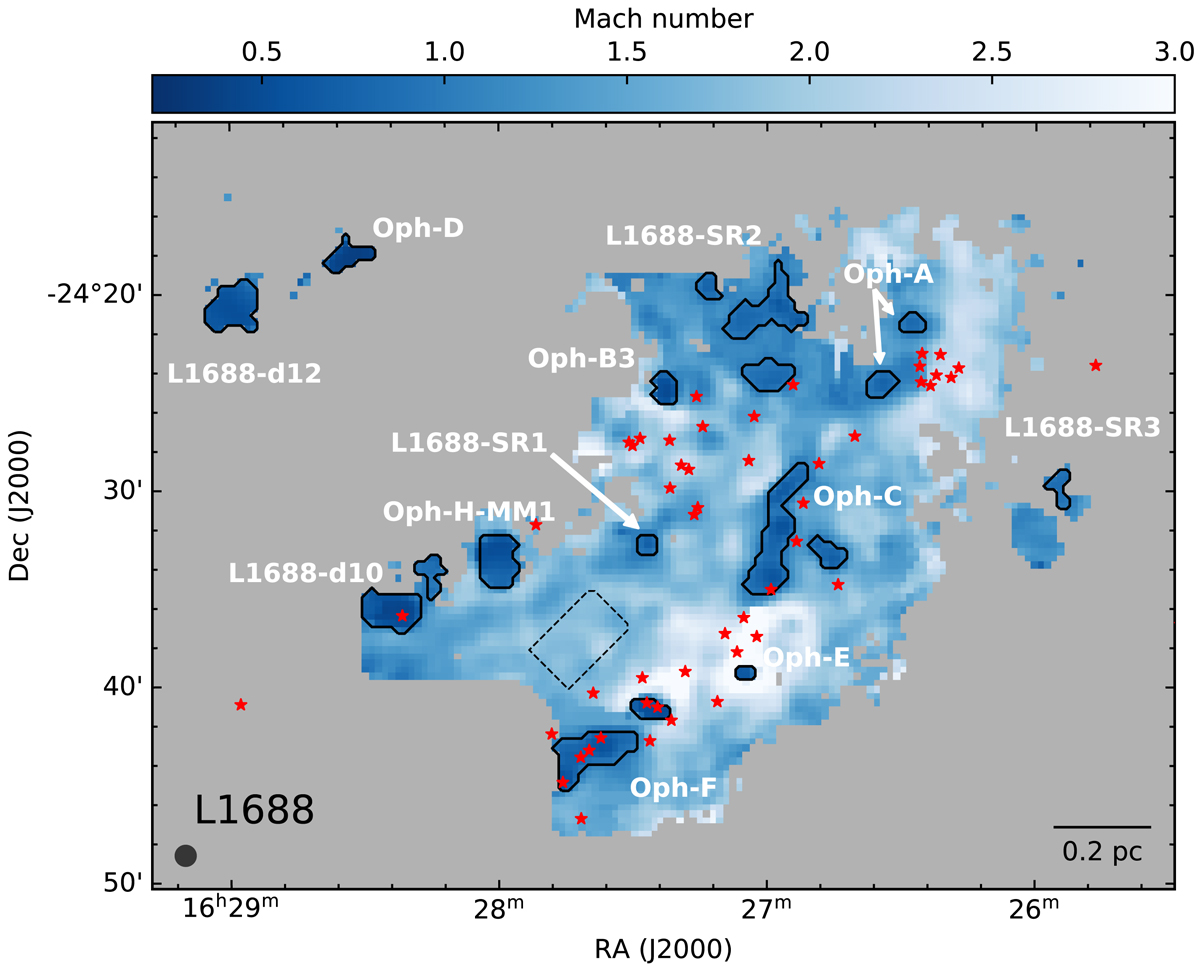
Coherent cores, as defined in Sect. 3.2, are shown by black contours. The background colour scale shows the sonic Mach number. The dashed rectangle shows the box considered to be representative of the ambient cloud. The red stars show positions of Class 0/I and flat-spectrum protostars in the cloud (Dunham et al. 2015). The beam and the scale bar are shown in the bottom left and bottom right corners, respectively.
Current usage metrics show cumulative count of Article Views (full-text article views including HTML views, PDF and ePub downloads, according to the available data) and Abstracts Views on Vision4Press platform.
Data correspond to usage on the plateform after 2015. The current usage metrics is available 48-96 hours after online publication and is updated daily on week days.
Initial download of the metrics may take a while.