Fig. 8.
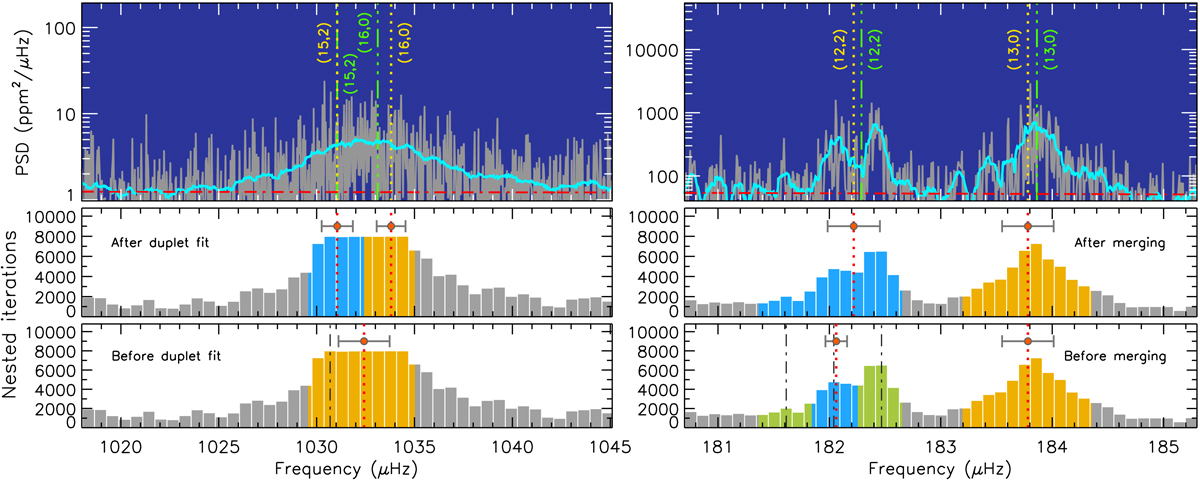
Identification of chunk quadrupole mode for the simulated F-type MS star 06550, having Teff = 6416 K (Ball et al. 2018) and corresponding to a 1-year length observation with TESS (left panels), and the RGB star KIC 12008916 observed with Kepler for more than four years (right panels). Top panels: similar to Fig. 6, top panels, but now showing a PSD region containing a ℓ = 2, 0 mode pair, where the frequencies estimated from CHUNK are indicated by vertical dotted yellow lines, with included the corresponding (n, ℓ) mode identification obtained by FAMED. The cyan curve is the PSD smoothed by a factor proportional to Γchunk. The vertical double-dot dashed green lines, and their mode identification, are from Ball et al. (2018) for the MS star, and from C15 for the RGB star. Middle and bottom panels: chunk ASEF showing ra, b (blue shading for ℓ = 2 and yellow for ℓ = 0), νf, i, σf, i, after and before applying a two-Lorentzian multimodal fit for the MS star, and a quadrupole mixed modes merging for the RGB star. The local maxima from the ASEF are marked by the vertical dot-dashed black lines, with green shading indicating the frequency ranges of those ASEF peaks that are merged.
Current usage metrics show cumulative count of Article Views (full-text article views including HTML views, PDF and ePub downloads, according to the available data) and Abstracts Views on Vision4Press platform.
Data correspond to usage on the plateform after 2015. The current usage metrics is available 48-96 hours after online publication and is updated daily on week days.
Initial download of the metrics may take a while.