Fig. 6.
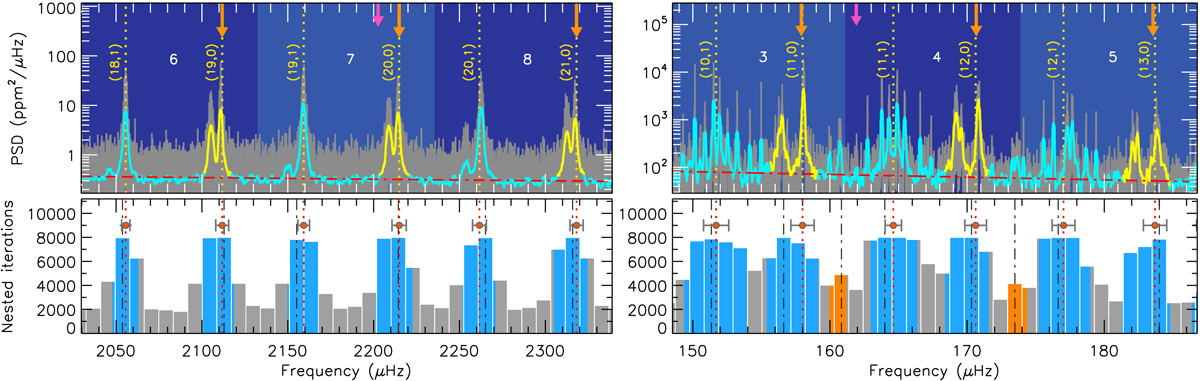
General mode identification, oscillation frequencies, and chunk division of GLOBAL. Left plots are for the MS star KIC 12069424, while right plots are for the low-luminosity RGB star KIC 12008916. Top panels: stellar PSD (dark gray) in logarithmic scale with a smoothing proportional to Γglobal overlaid (thick cyan curve, with yellow chunks representing ℓ = 2, 0 pairs). The level of the background estimated is shown by a horizontal dot-dashed red line. The vertical dotted yellow lines mark the frequencies νf, i resulting from Sect 4.6. The general mode identification (n, ℓ) (see Sect. 4.5) is indicated next to each frequency position. The orange downward-pointing arrows mark the asymptotic position of the radial modes, while the purple one shows the position of νmax. The blue-shaded background (using alternate tonalities) indicates the different PSD chunks identified, with the individual chunk number reported. Bottom panels: ASEF showing the position of the local maxima νi (vertical dashed black lines). The blue-shaded regions mark ra, b around each local maximum. The estimated frequencies νf, i shown in the top panels are indicated by vertical dotted red lines and red bullets, with their corresponding 1-σ uncertainties σf, i. The orange-shaded regions mark ra, b for those local maxima corresponding to the frequencies νf, i that were discarded during the skimming process.
Current usage metrics show cumulative count of Article Views (full-text article views including HTML views, PDF and ePub downloads, according to the available data) and Abstracts Views on Vision4Press platform.
Data correspond to usage on the plateform after 2015. The current usage metrics is available 48-96 hours after online publication and is updated daily on week days.
Initial download of the metrics may take a while.