Fig. 3.
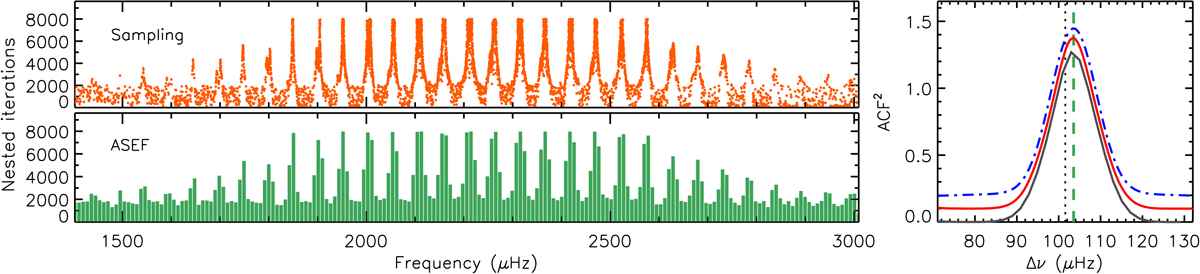
Estimating ΔνACF in GLOBAL for the G-type MS star KIC 12069424. Top-left panel: global multimodal fit with DIAMONDS, with a regular structure in frequency resembling the asymptotic pattern of p modes. Bottom-left panel: resulting ASEF, here in standard resolution for plotting purposes, containing 31 local maxima. Right panel: ACF2 (computed at the frequency resolution of the PSD) of the high-resolution ASEF (solid black line), with the interpolated ACF2 using a resolution higher than the PSD (about 100 bins in total, solid red line), and the final Gaussian fit to the interpolated ACF2 (dot-dashed blue line). The red and blue curves have been offset by +0.1 and +0.2 in amplitude, respectively, for a clear visualization. The vertical dotted line is Δν from the νmax–Δν relation, while the vertical dashed green line is the final ΔνACF.
Current usage metrics show cumulative count of Article Views (full-text article views including HTML views, PDF and ePub downloads, according to the available data) and Abstracts Views on Vision4Press platform.
Data correspond to usage on the plateform after 2015. The current usage metrics is available 48-96 hours after online publication and is updated daily on week days.
Initial download of the metrics may take a while.