Fig. 19.
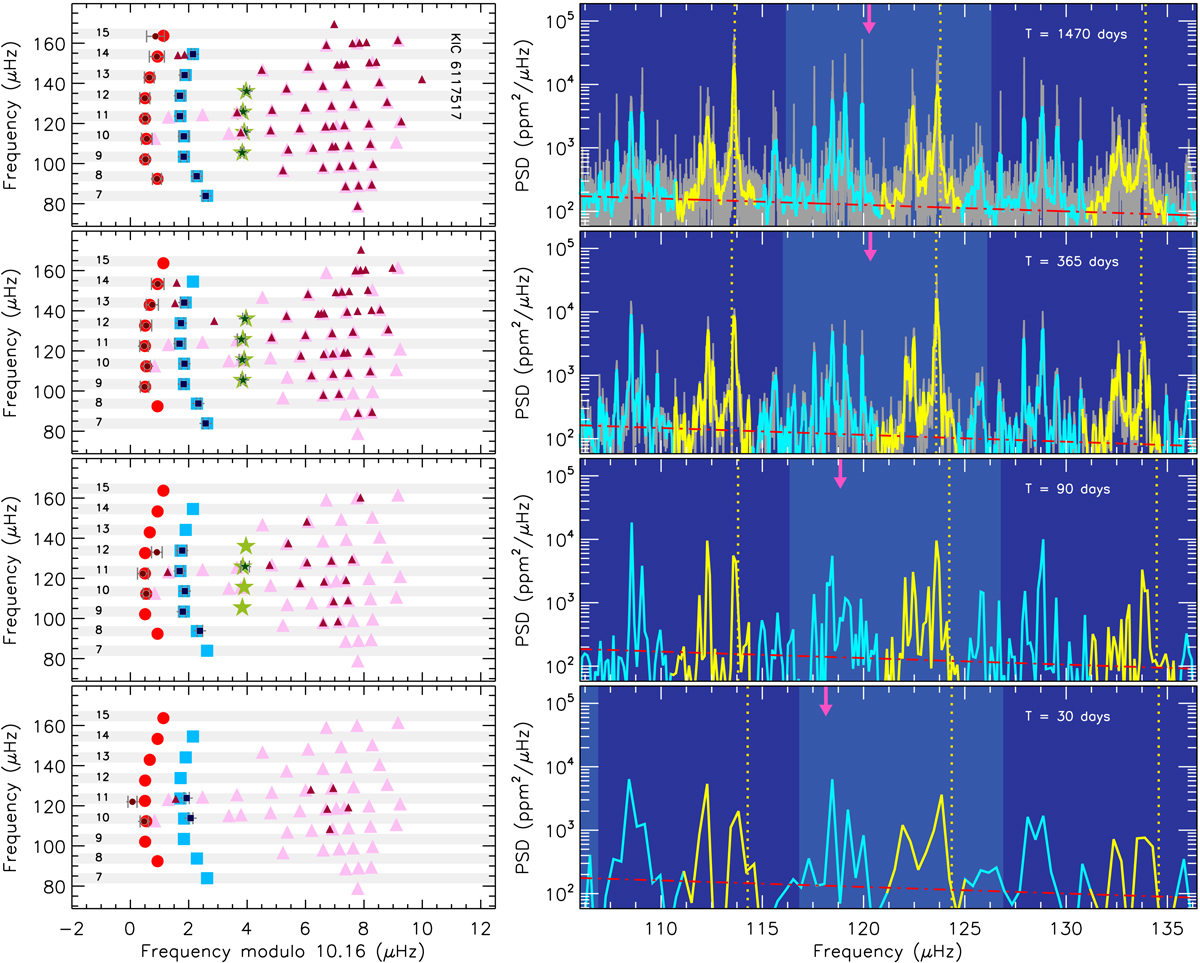
Peak bagging analysis of the low-luminosity RGB star KIC 6117517 by degrading the frequency resolution of the stellar PSD. Left panels: échelle diagrams obtained for four different frequency resolutions, with same description as in Fig. 15. The literature frequencies and the folding Δν value are those by C15. Right panels: three most central chunks of the stellar PSD (in gray) as seen from GLOBAL for each test performed, with ℓ = 2, 0 regions in yellow. The purple arrows mark the position of νmax obtained from a background fit to each test PSD. Only global radial mode frequencies are indicated (vertical dotted lines). The smoothing of the PSD is coinciding with the PSD itself for the two bottom panels because of the low frequency resolution.
Current usage metrics show cumulative count of Article Views (full-text article views including HTML views, PDF and ePub downloads, according to the available data) and Abstracts Views on Vision4Press platform.
Data correspond to usage on the plateform after 2015. The current usage metrics is available 48-96 hours after online publication and is updated daily on week days.
Initial download of the metrics may take a while.