Fig. 18.
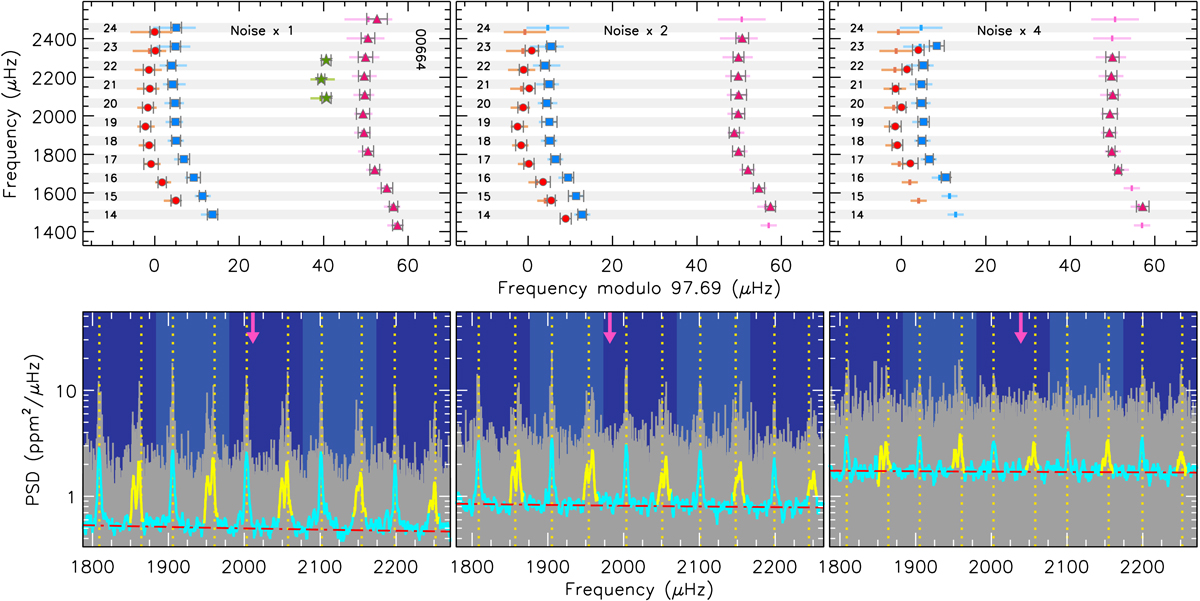
Peak bagging analysis of the simulated MS star 00664 by degrading the instrumental noise in the stellar PSD. Top panels: échelle diagrams obtained for three different noise levels, with same description as in Fig. 11. The folding Δν value is that by Ball et al. (2018). Bottom panels: five most central chunks of the stellar PSD as seen from GLOBAL, with similar description as in Fig. 6. The purple arrow marks the position of νmax obtained from an independent background fit to each PSD.
Current usage metrics show cumulative count of Article Views (full-text article views including HTML views, PDF and ePub downloads, according to the available data) and Abstracts Views on Vision4Press platform.
Data correspond to usage on the plateform after 2015. The current usage metrics is available 48-96 hours after online publication and is updated daily on week days.
Initial download of the metrics may take a while.