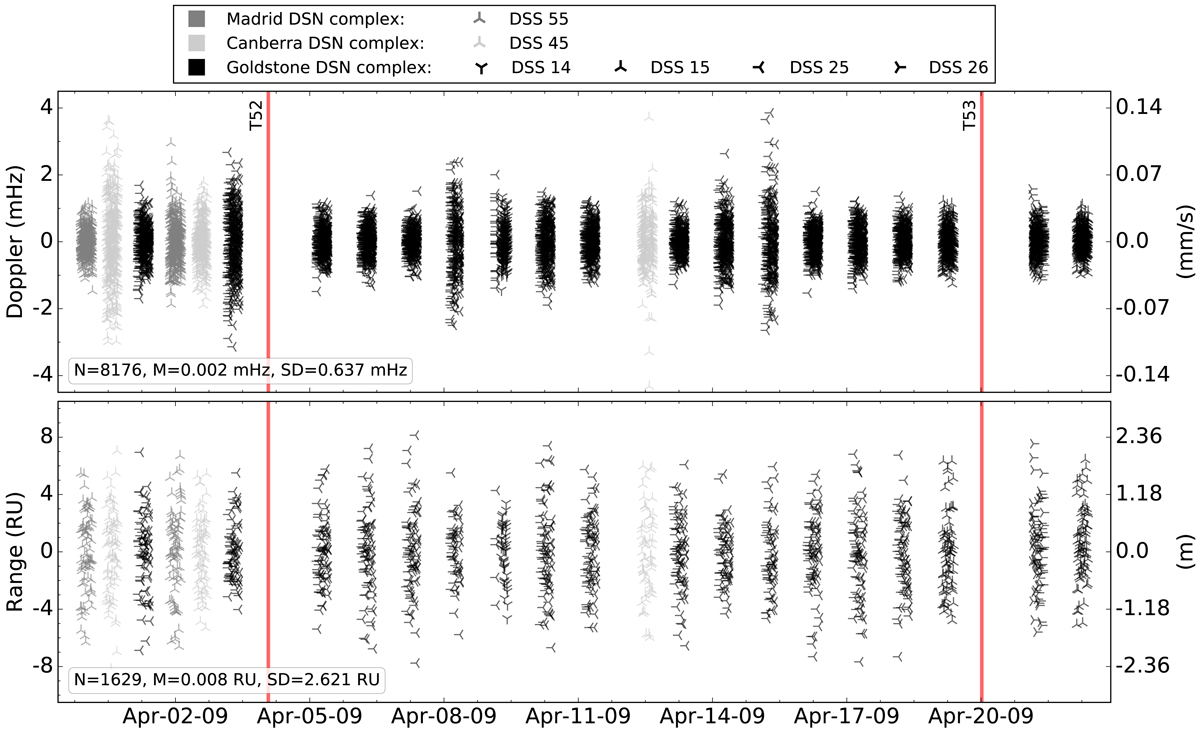
Fig. 1.

Residuals of two-way Doppler data at 60 s count-time (top) and range data at 300 s (bottom) for a typical arc. The different colours and markers specify the complex and specific Deep Space Station (DSS) used for each tracking pass. The red vertical lines indicate the two flybys of Titan performed within the analysed period. In the bottom left boxes, the amount, mean, and standard deviation of residuals are reported.
Current usage metrics show cumulative count of Article Views (full-text article views including HTML views, PDF and ePub downloads, according to the available data) and Abstracts Views on Vision4Press platform.
Data correspond to usage on the plateform after 2015. The current usage metrics is available 48-96 hours after online publication and is updated daily on week days.
Initial download of the metrics may take a while.


