Fig. 7.
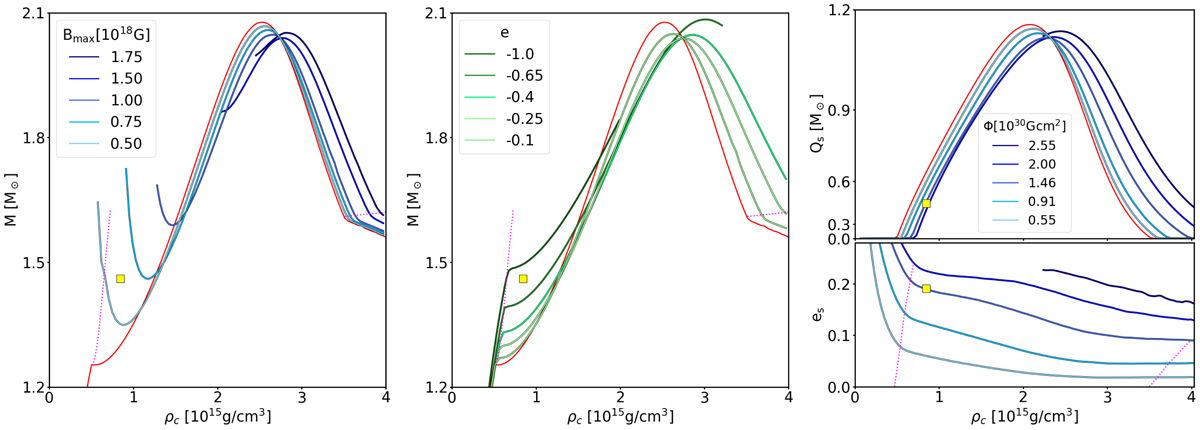
Sequences for the models with purely toroidal magnetic field and β0 = −6. Left panel: mass-density relation computed at fixed Bmax (blue lines) compared with the un-magnetised sequence (red line). Middle panel: mass-density relation computed at fixed e (green lines) compared with the un-magnetised sequence (red line). Right panel: On top, scalar charge computed at fixed Φ (blue lines) compared with the un-magnetised sequence (red line); on bottom, trace quadrupole deformation es. In all panels, the dotted magenta lines represent the limit for spontaneous scalarisation and the yellow square represents model T of Fig. 2.
Current usage metrics show cumulative count of Article Views (full-text article views including HTML views, PDF and ePub downloads, according to the available data) and Abstracts Views on Vision4Press platform.
Data correspond to usage on the plateform after 2015. The current usage metrics is available 48-96 hours after online publication and is updated daily on week days.
Initial download of the metrics may take a while.