Fig. 3.
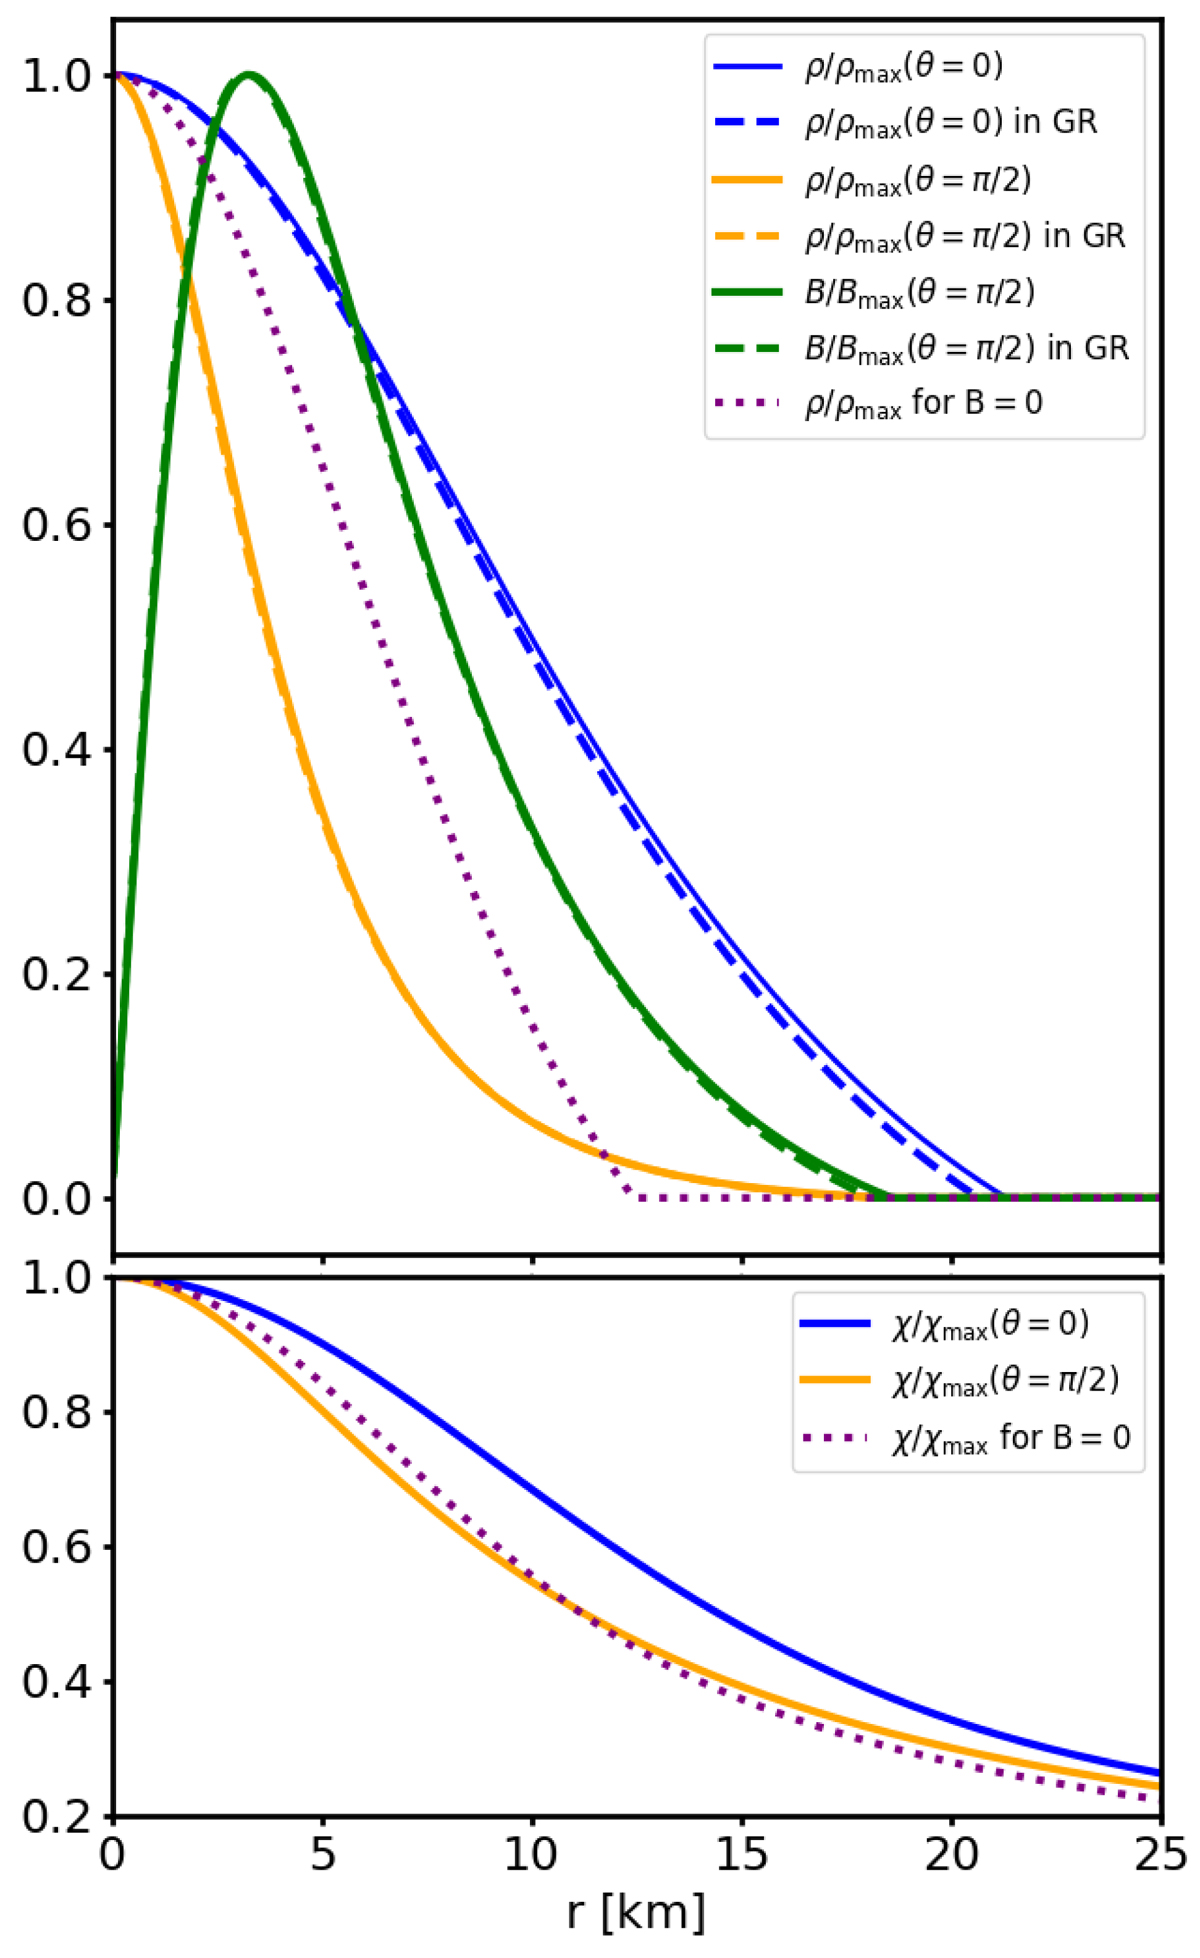
Upper panel: profile of the polar (solid blue lines) and equatorial (solid orange lines) density, and of the magnetic field strength at the equator (solid green lines), normalised to their maximum values, for the equilibrium model T (with purely toroidal magnetic field) of Table 2. These are to be compared to the corresponding GR model at the same ρc and Bmax (dashed lines), and with the density of the scalarised and un-magnetised model at the same ρc, T0 (dotted purple line). Lower panel: profile of the equatorial (orange line) and polar (blue line) scalar field, normalised to the maximum value, for the equilibrium model T (solid), compared to the un-magnetised model T0 (dotted purple).
Current usage metrics show cumulative count of Article Views (full-text article views including HTML views, PDF and ePub downloads, according to the available data) and Abstracts Views on Vision4Press platform.
Data correspond to usage on the plateform after 2015. The current usage metrics is available 48-96 hours after online publication and is updated daily on week days.
Initial download of the metrics may take a while.