Fig. 11.
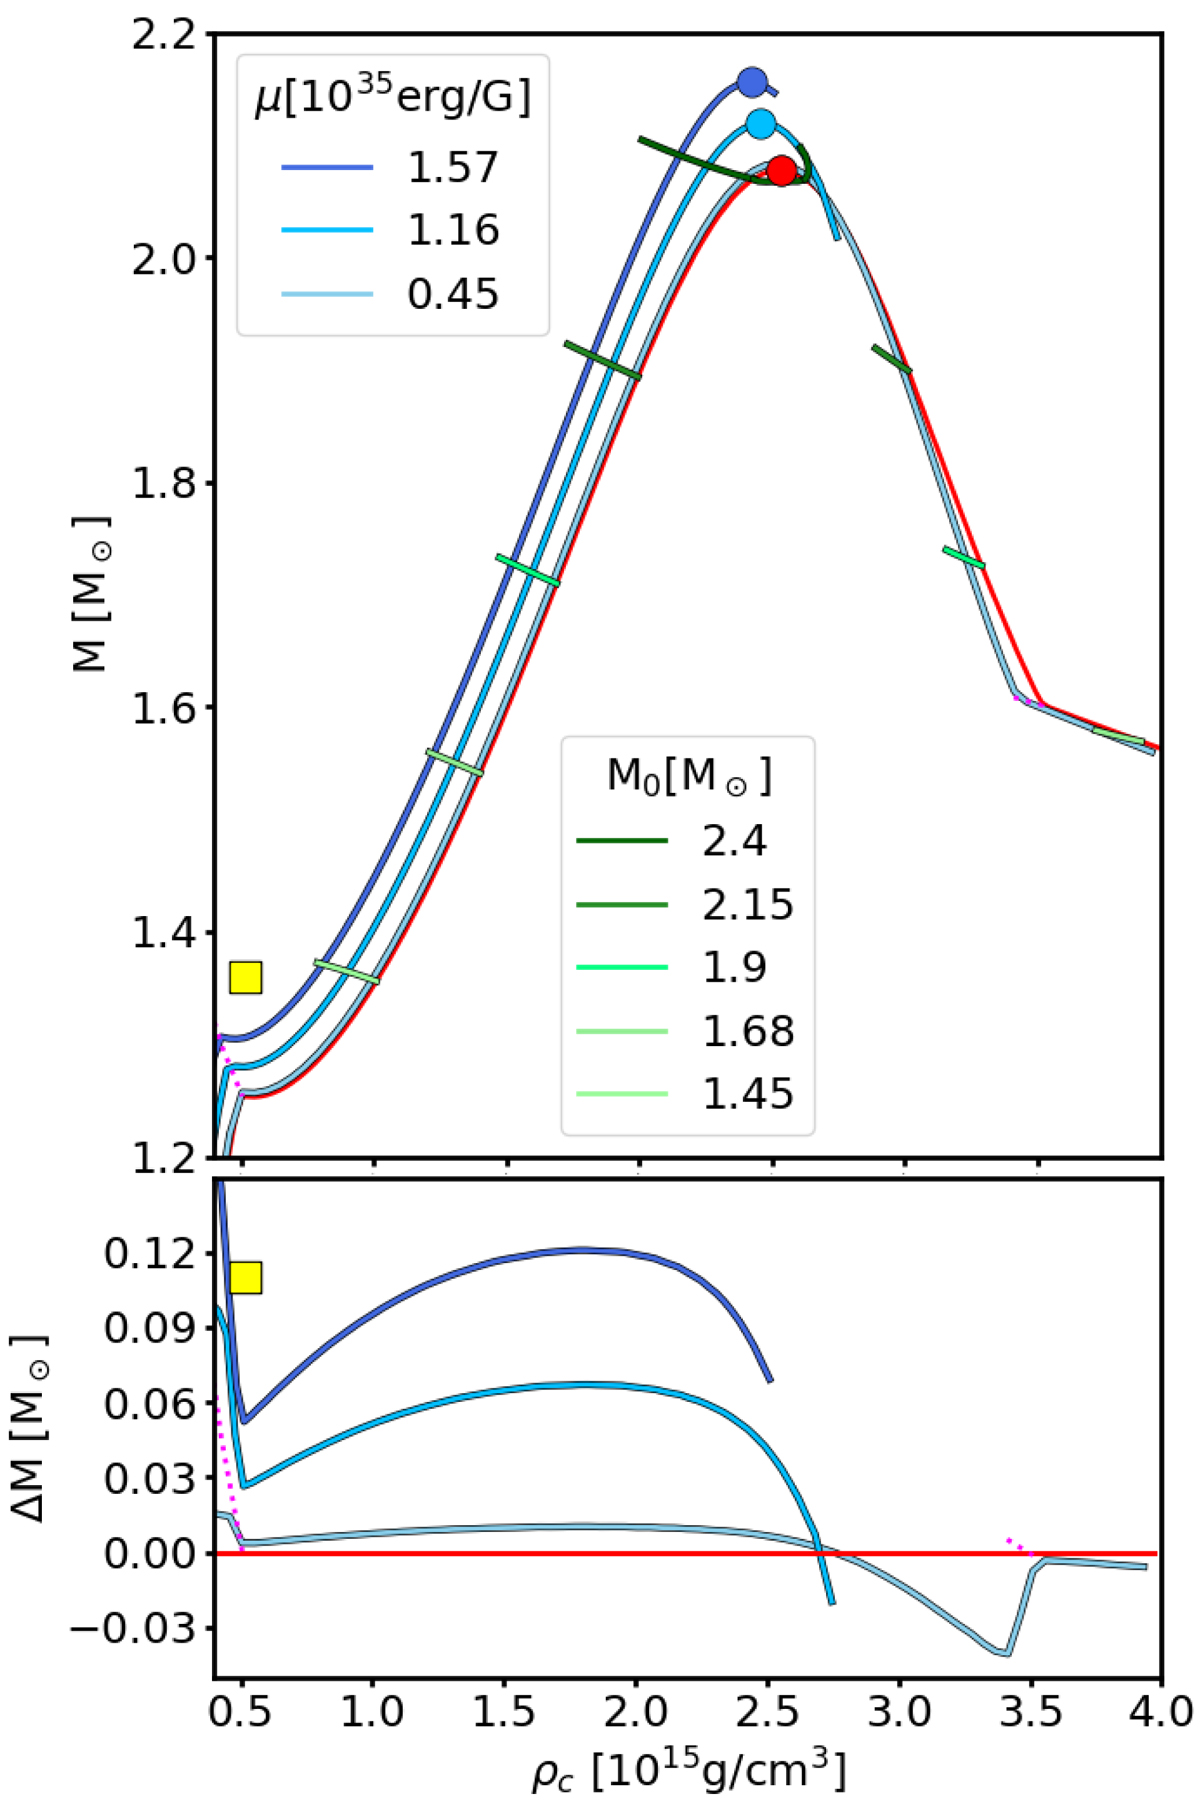
Mass-density sequences for models with purely poloidal magnetic field and β0 = −6. Upper panel: sequences computed at fixed values of the magnetic dipole moment μ (blue lines) and at fixed baryonic mass (green lines), compared with the un-magnetised case (red line). The dotted magenta lines represent the limit for spontaneous scalarisation. Dots mark the position of the maximum mass models UM0 (red), PM1 (light blue) and PM2 (dark blue) of Table 3. The yellow square represents the model of Fig. 8. Lower panel: mass difference of sequences at fixed μ with respect to the un-magnetised one.
Current usage metrics show cumulative count of Article Views (full-text article views including HTML views, PDF and ePub downloads, according to the available data) and Abstracts Views on Vision4Press platform.
Data correspond to usage on the plateform after 2015. The current usage metrics is available 48-96 hours after online publication and is updated daily on week days.
Initial download of the metrics may take a while.