Fig. 10.
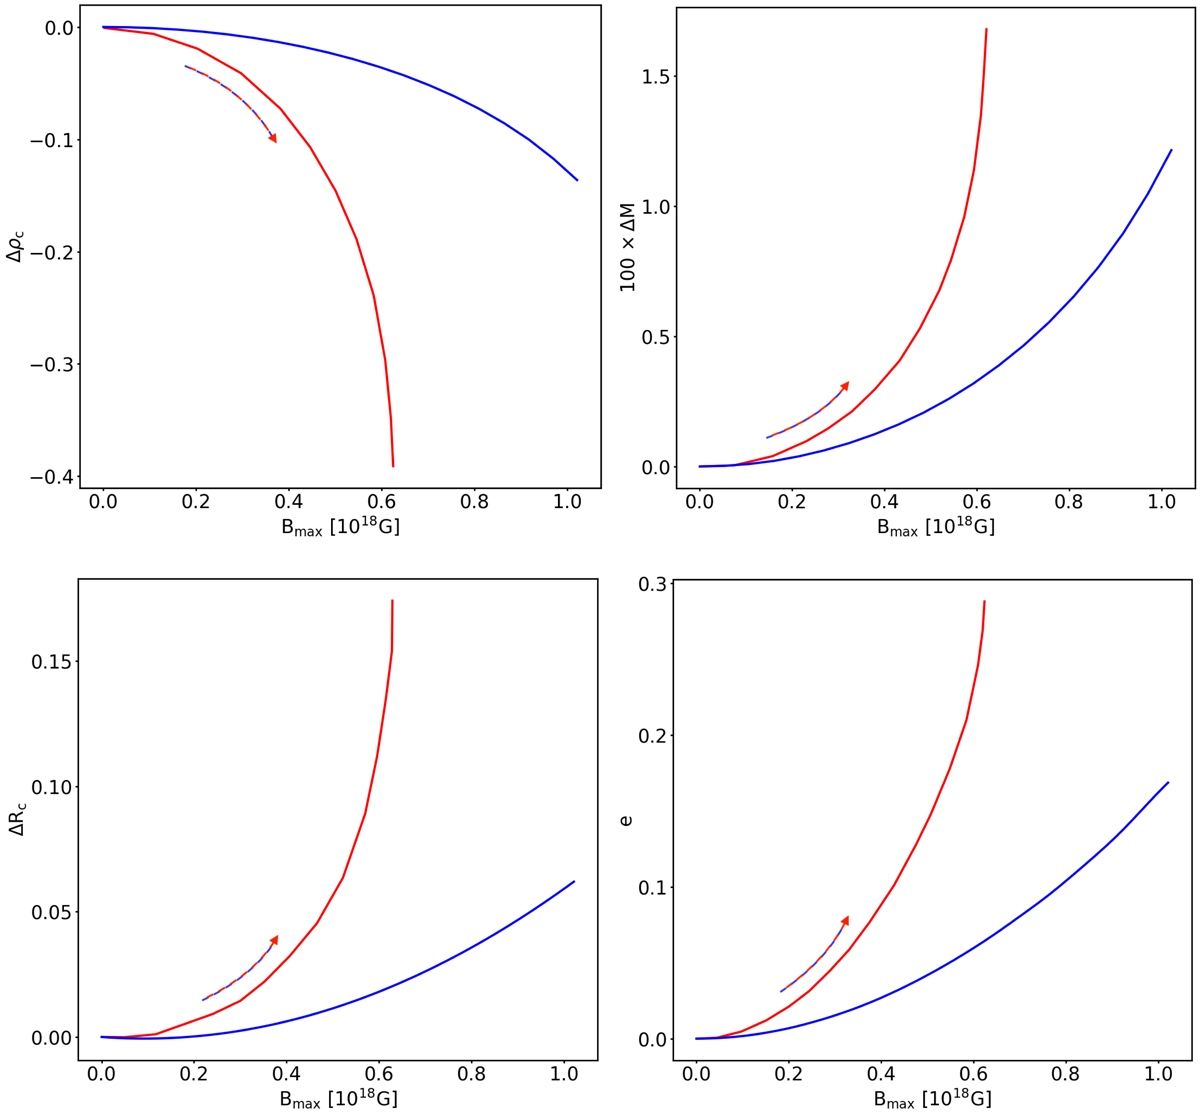
Variation, with respect to the un-magnetised model, of various quantities along the equilibrium sequence with constant M0 = 1.68 M⊙ for purely poloidal magnetic field. From left to right, top to bottom: central density ρc, Komar mass Mk, circumferential radius Rc and quadrupole deformation e. The blue line represents our STT results, to be compared to the red line, describing the GR models of Pili et al. (2014, Fig. 7). The arrows show the direction of increasing magnetisation.
Current usage metrics show cumulative count of Article Views (full-text article views including HTML views, PDF and ePub downloads, according to the available data) and Abstracts Views on Vision4Press platform.
Data correspond to usage on the plateform after 2015. The current usage metrics is available 48-96 hours after online publication and is updated daily on week days.
Initial download of the metrics may take a while.