Fig. 5
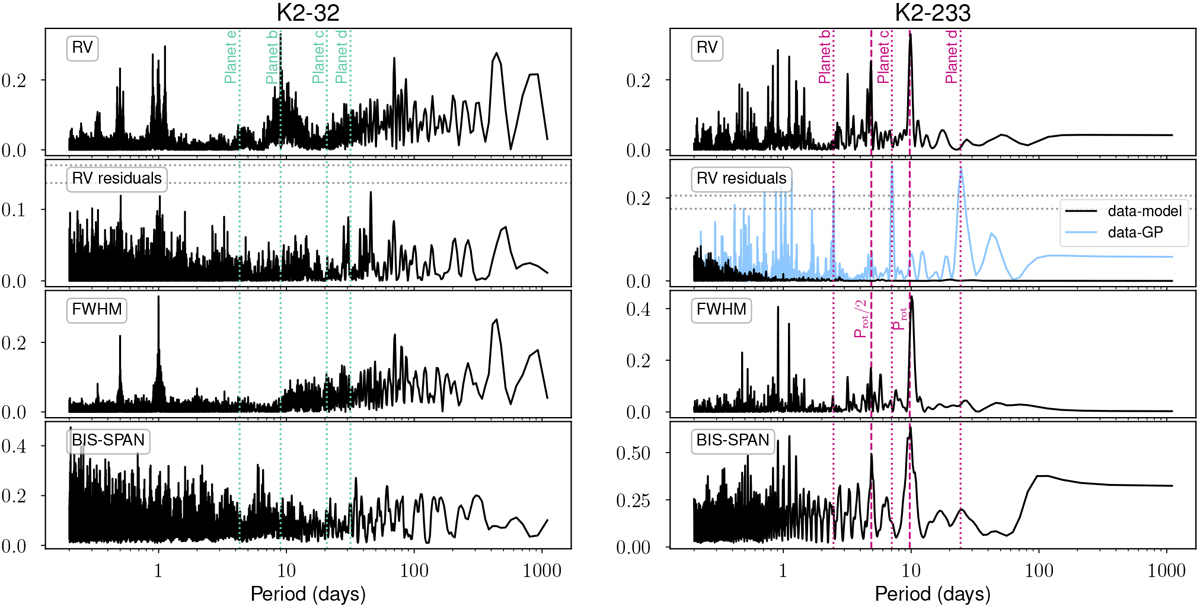
Lomb-Scargle periodogram of the HARPS radial velocity datasets and activity indicators from K2-32 (left panels) and K2-233 (right panels). For each system we show, from top to bottom, the periodogram corresponding to: the radial velocity, the residuals after subtracting the radial velocity model (for K2-233 we also show the residuals of the GP model) and the 1 and 0.1% false alarm probabilities as horizontal dotted lines, the full-width at half maximum of the cross-correlation function and the bisector span. The planet periods are marked as dotted lines and the rotation period of K2-233 and its first harmonic are marked as dashed lines.
Current usage metrics show cumulative count of Article Views (full-text article views including HTML views, PDF and ePub downloads, according to the available data) and Abstracts Views on Vision4Press platform.
Data correspond to usage on the plateform after 2015. The current usage metrics is available 48-96 hours after online publication and is updated daily on week days.
Initial download of the metrics may take a while.