Fig. 2
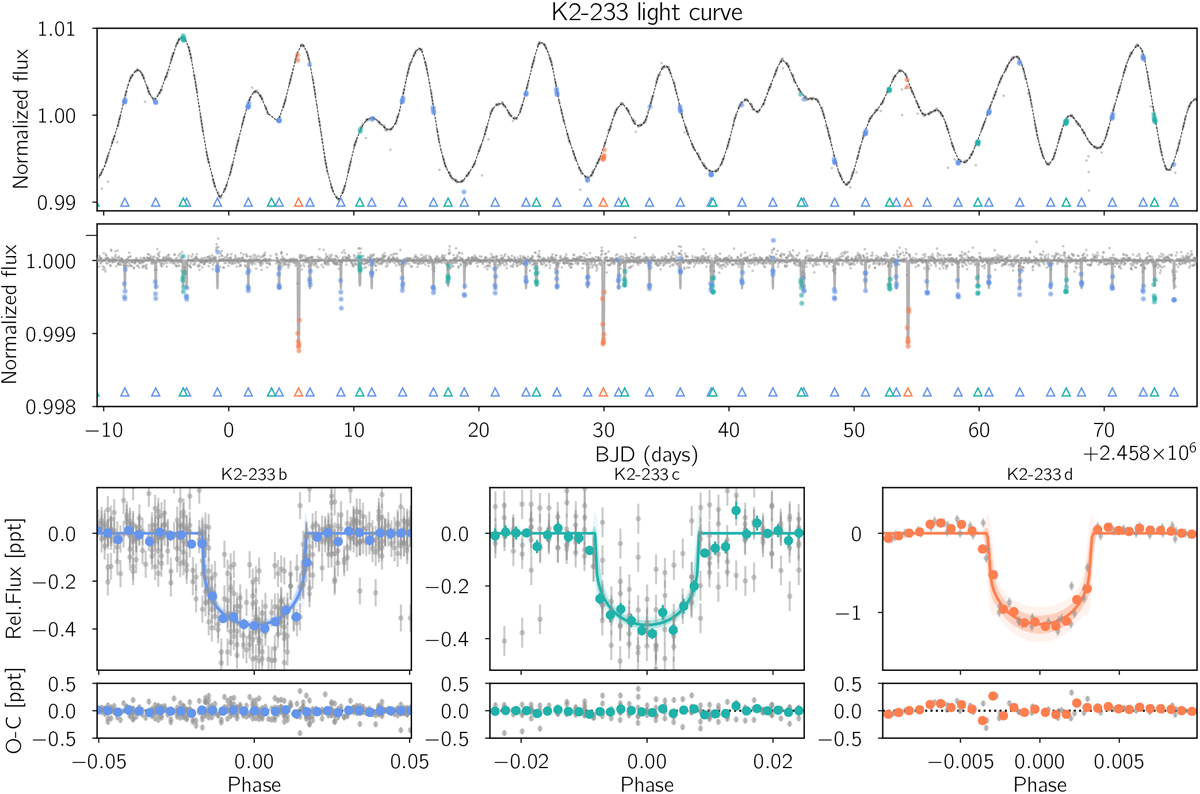
Photometric data and inferred model for K2-233. Top: K2 extracted photometry (grey dots, see Sect. 2.1) and mean GP model (black dashed line). The transits for each individual planet are marked by upward triangles and colour-coded in the light curve. Middle: detrended light curve after removing the GP model and the spline high-frequency filtering (see Sect. 2.1) and including the median transit model obtained with PASTIS for the 4 planets in the system (grey solid line). Bottom: phase-folded lightcurves centred on the transit of each planet. The colour-coded symbols correspond to binned photometry with a bin size of 10% of the transit duration. The inferred transit models are shown as solid lines. The shaded regions correspond to 68.7% (dark colour) and 95% (light colour) confidence intervals.
Current usage metrics show cumulative count of Article Views (full-text article views including HTML views, PDF and ePub downloads, according to the available data) and Abstracts Views on Vision4Press platform.
Data correspond to usage on the plateform after 2015. The current usage metrics is available 48-96 hours after online publication and is updated daily on week days.
Initial download of the metrics may take a while.