Fig. 9
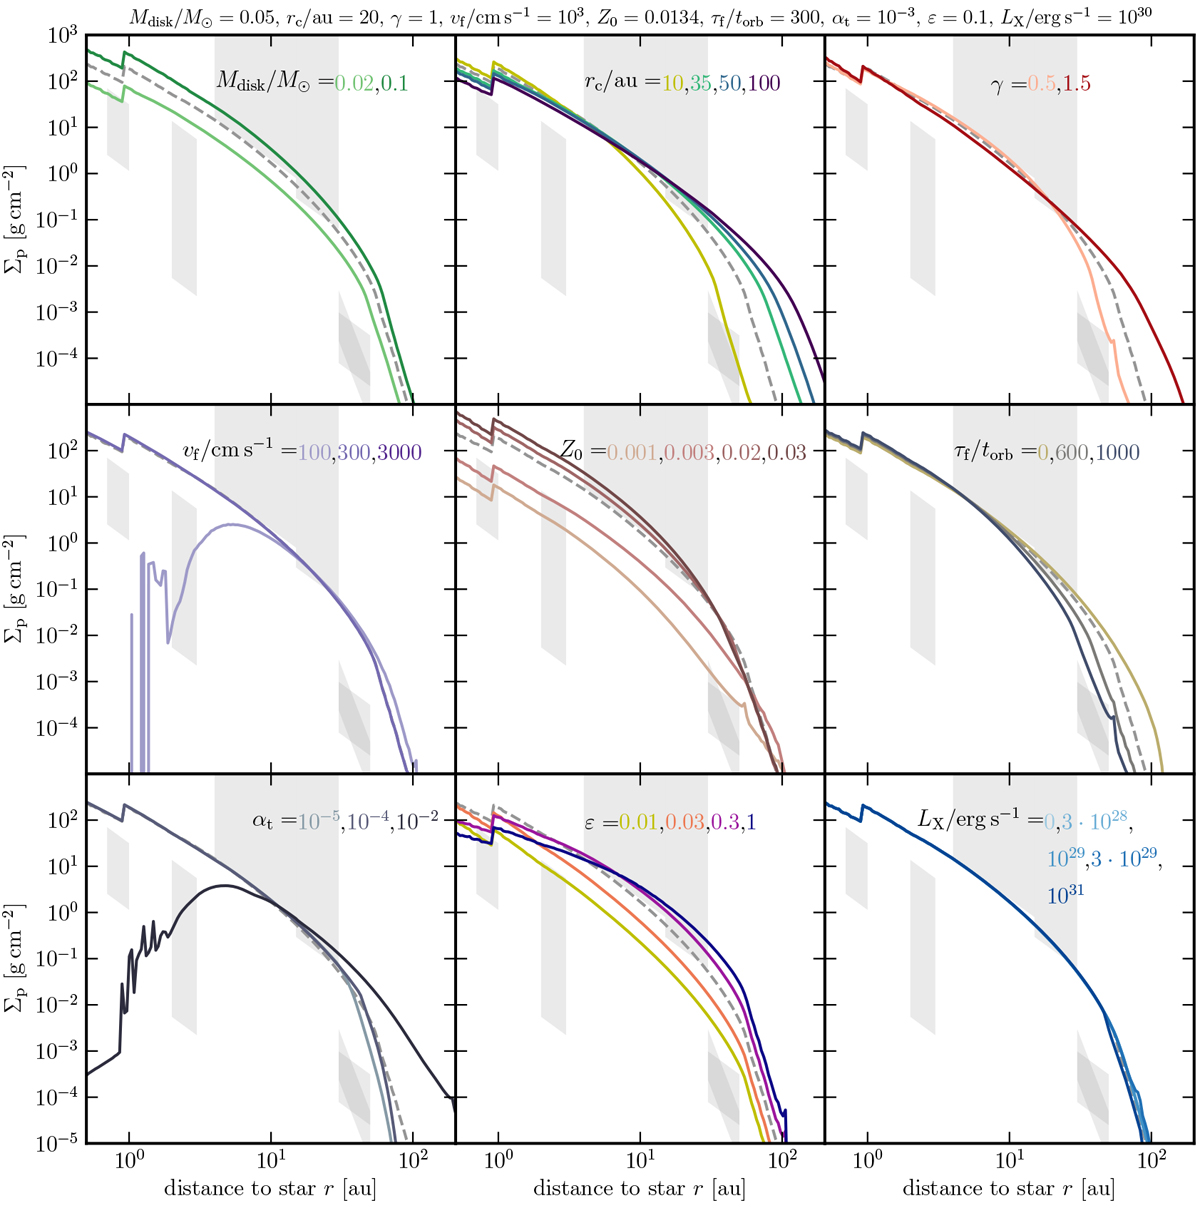
Final (at 10 Myr) planetesimal column density as a function of disk radius for the first sample (gray values in Table 1). The fiducialvalues for this set of simulations are shown in the header of the plot. In each panel, the simulation with those parameters is shown as dashed gray line, and the solid lines with colors show simulation results where only one parameter of the set was changed. The gray areas represent the constraints that we described in Sect. 2, where the mass in the given region was translated into a column density, assuming a planetesimal profile ∝ r−2.25 (see Eq. (37) of Lenz et al. 2019). For the outermost region, we also overplotted a box ∝ r−8.
Current usage metrics show cumulative count of Article Views (full-text article views including HTML views, PDF and ePub downloads, according to the available data) and Abstracts Views on Vision4Press platform.
Data correspond to usage on the plateform after 2015. The current usage metrics is available 48-96 hours after online publication and is updated daily on week days.
Initial download of the metrics may take a while.