Fig. 6
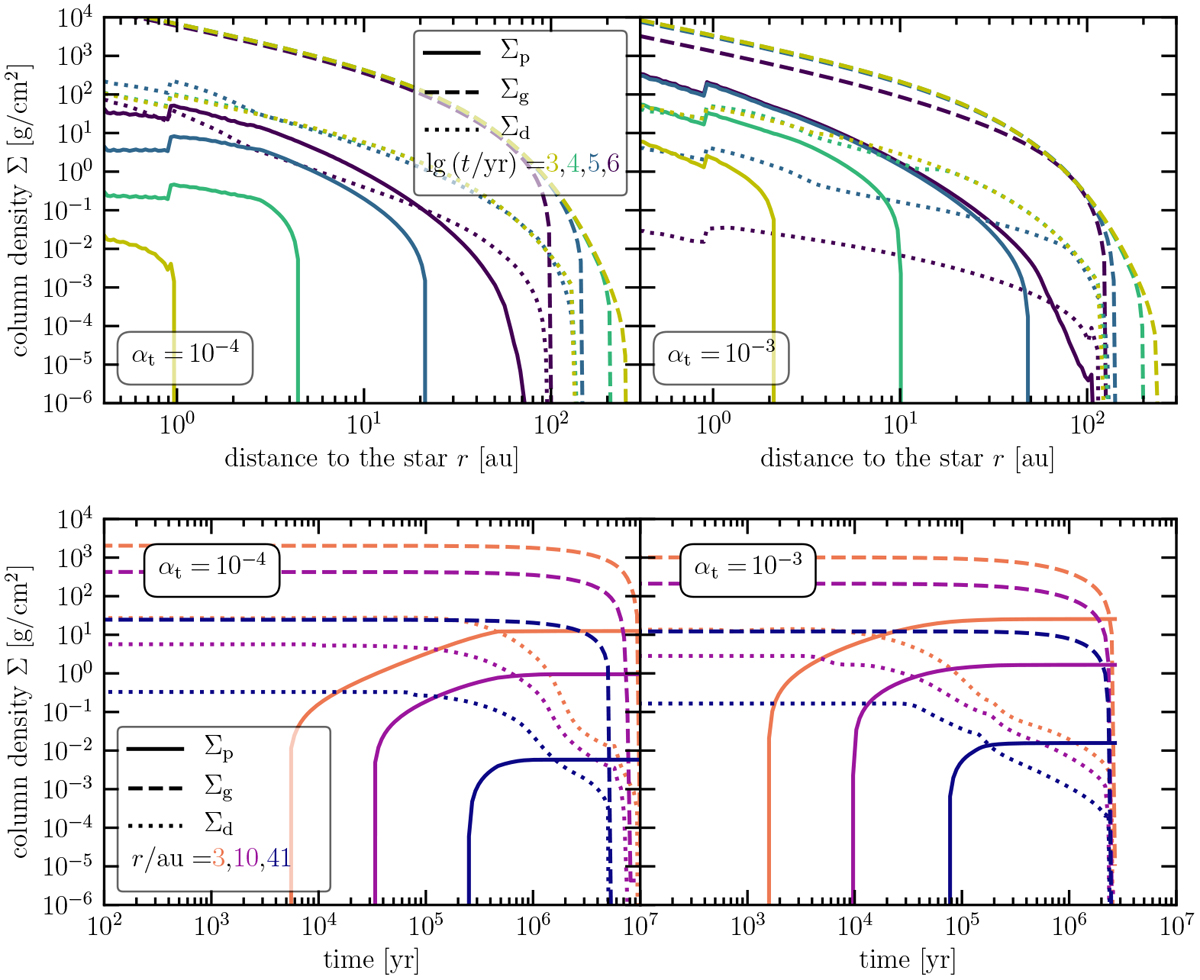
Top panels: planetesimal (solid), gas (dashed), and total dust (dotted) vertically integrated density profiles at different times. Bottom panels: same quantities, but as a function of time, for three different disk locations. Both fiducial simulations are compared, where the first (gray values in Table 1) is shown in the right and the second (bold valuesin Table 1) in the left panels.
Current usage metrics show cumulative count of Article Views (full-text article views including HTML views, PDF and ePub downloads, according to the available data) and Abstracts Views on Vision4Press platform.
Data correspond to usage on the plateform after 2015. The current usage metrics is available 48-96 hours after online publication and is updated daily on week days.
Initial download of the metrics may take a while.