Fig. 4
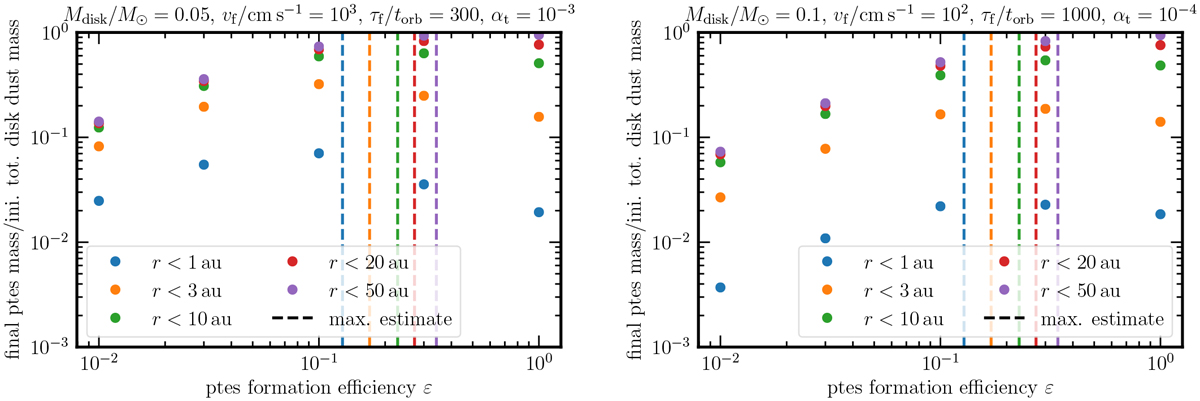
Final mass in planetesimals within a given disk radius shown in the legend, normalized to the initial total disk dust mass, as a function of planetesimal formation efficiency. Defining ε = 5hg ∕ℓ, where ℓ is theconversion length over which pebbles are transformed into planetesimals. The vertical dashed lines show the predicted maximum at the outer edge of the respective zone. This means that the dashed blue line shows the predicted maximum at 1 au and the purple line shows this at 50 au. This plot shows ε variations from the first fiducial run (gray values in Table 1) in the left panel and from the second fiducial run in the right panel (bold values in Table 1).
Current usage metrics show cumulative count of Article Views (full-text article views including HTML views, PDF and ePub downloads, according to the available data) and Abstracts Views on Vision4Press platform.
Data correspond to usage on the plateform after 2015. The current usage metrics is available 48-96 hours after online publication and is updated daily on week days.
Initial download of the metrics may take a while.