Fig. B.1
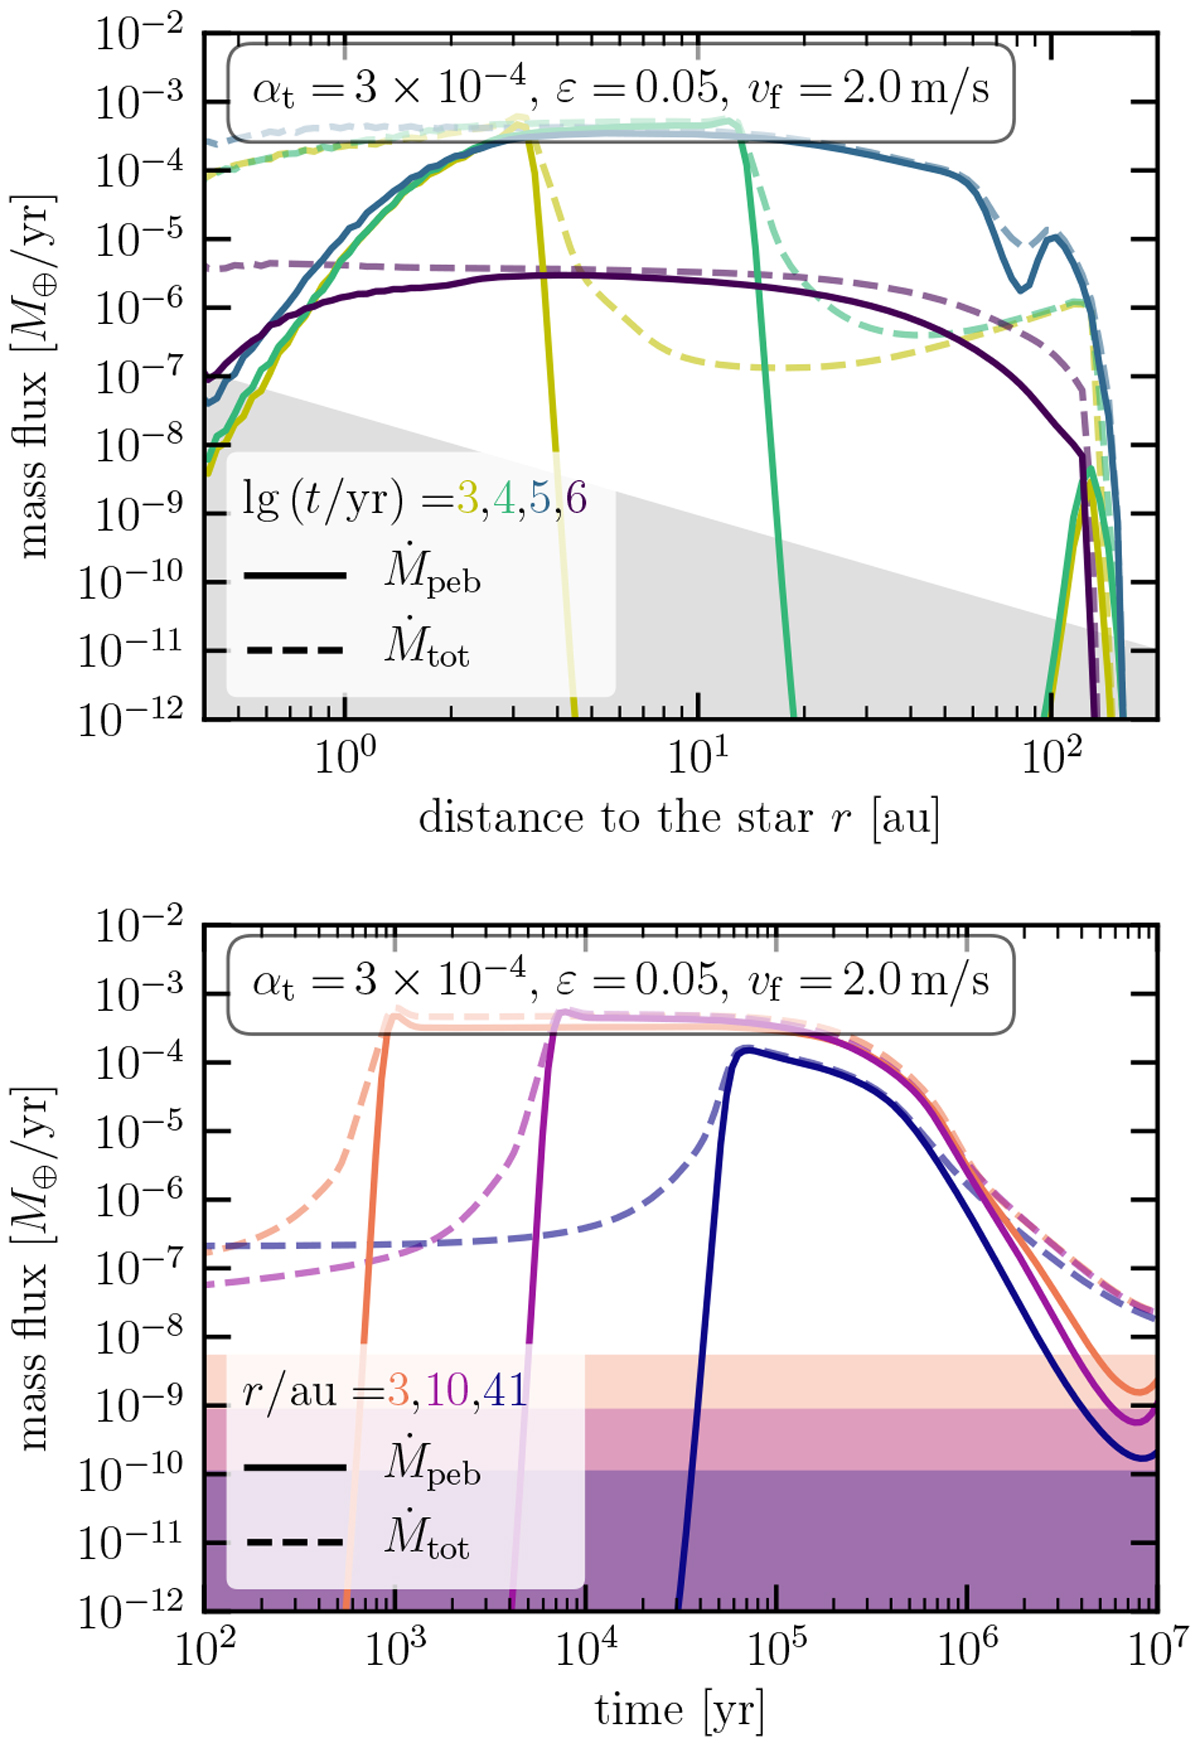
Pebble flux in units of Earth masses per year for different times as a function of disk radius (upper panel) and as a function oftime for different disk locations (lower panel). Here, we show data from the accretion heating simulation (the most appropriate case, see the last row in Table 1). Solid lines show the pebble flux using the smoothing function Eq. (31), dashed lines show the total flux, i.e., taking all solid material into account, except for planetesimals. For the upper panels, sub-critical fluxes are marked by the gray zone. They are shown in the respective colors in thelower panels.
Current usage metrics show cumulative count of Article Views (full-text article views including HTML views, PDF and ePub downloads, according to the available data) and Abstracts Views on Vision4Press platform.
Data correspond to usage on the plateform after 2015. The current usage metrics is available 48-96 hours after online publication and is updated daily on week days.
Initial download of the metrics may take a while.