Fig. 10
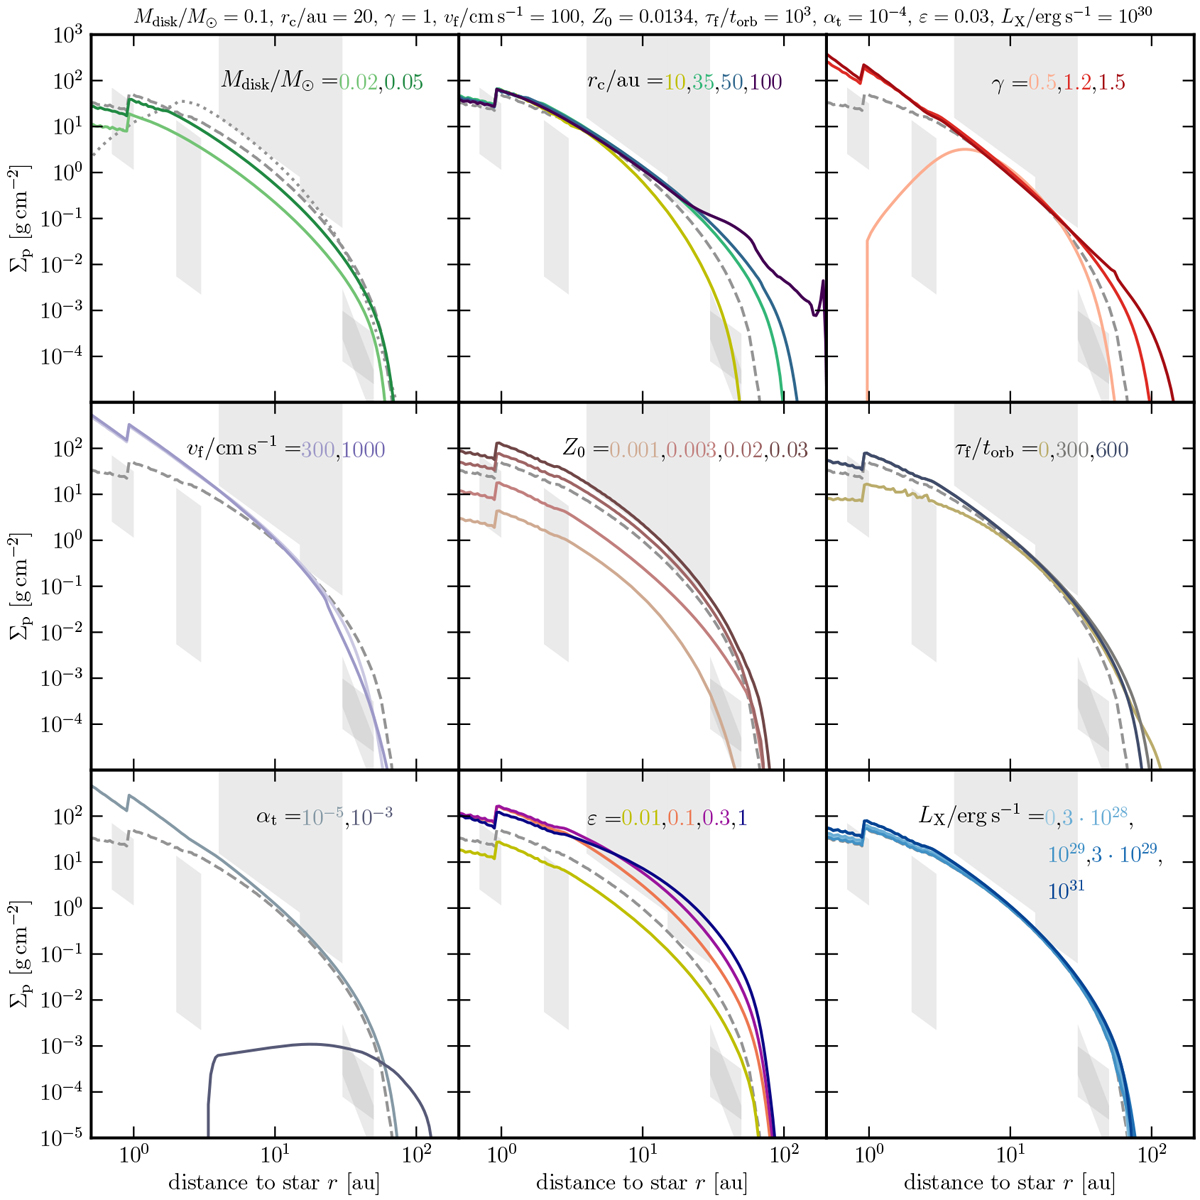
Same as Fig. 9, but for the second sample (variations to the bold values in Table 1). If ε is high enough, photoevaporation does not change the result significantly. It seems to have an effect for low ε, however; see the yellow line in the bottom middle panel of Fig. 8. Top left panel: we also plot the most appropriate case as a dotted line (last row in Table 1).
Current usage metrics show cumulative count of Article Views (full-text article views including HTML views, PDF and ePub downloads, according to the available data) and Abstracts Views on Vision4Press platform.
Data correspond to usage on the plateform after 2015. The current usage metrics is available 48-96 hours after online publication and is updated daily on week days.
Initial download of the metrics may take a while.