Fig. 1
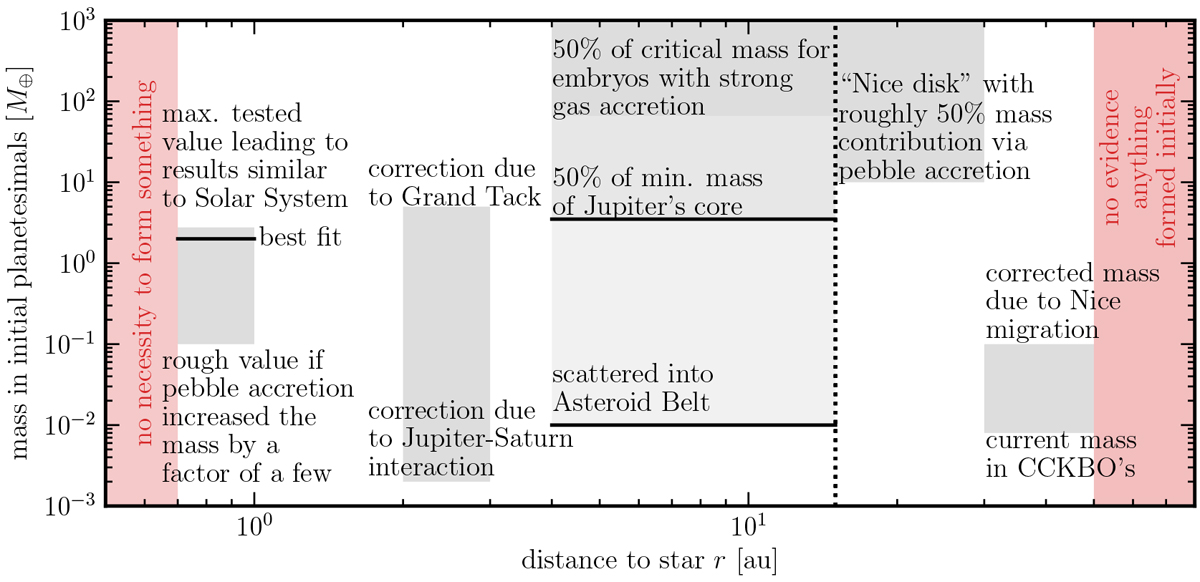
Graphical representation summarizing Sect. 2 on mass constraints of initial planetesimal masses in different regions of the solar nebula. Masses given by the values on the ordinate apply for the entire marked regions. Boxes that extend to the border of the plot indicate unknown upper limits. The dotted vertical line separates the two touching regions.
Current usage metrics show cumulative count of Article Views (full-text article views including HTML views, PDF and ePub downloads, according to the available data) and Abstracts Views on Vision4Press platform.
Data correspond to usage on the plateform after 2015. The current usage metrics is available 48-96 hours after online publication and is updated daily on week days.
Initial download of the metrics may take a while.