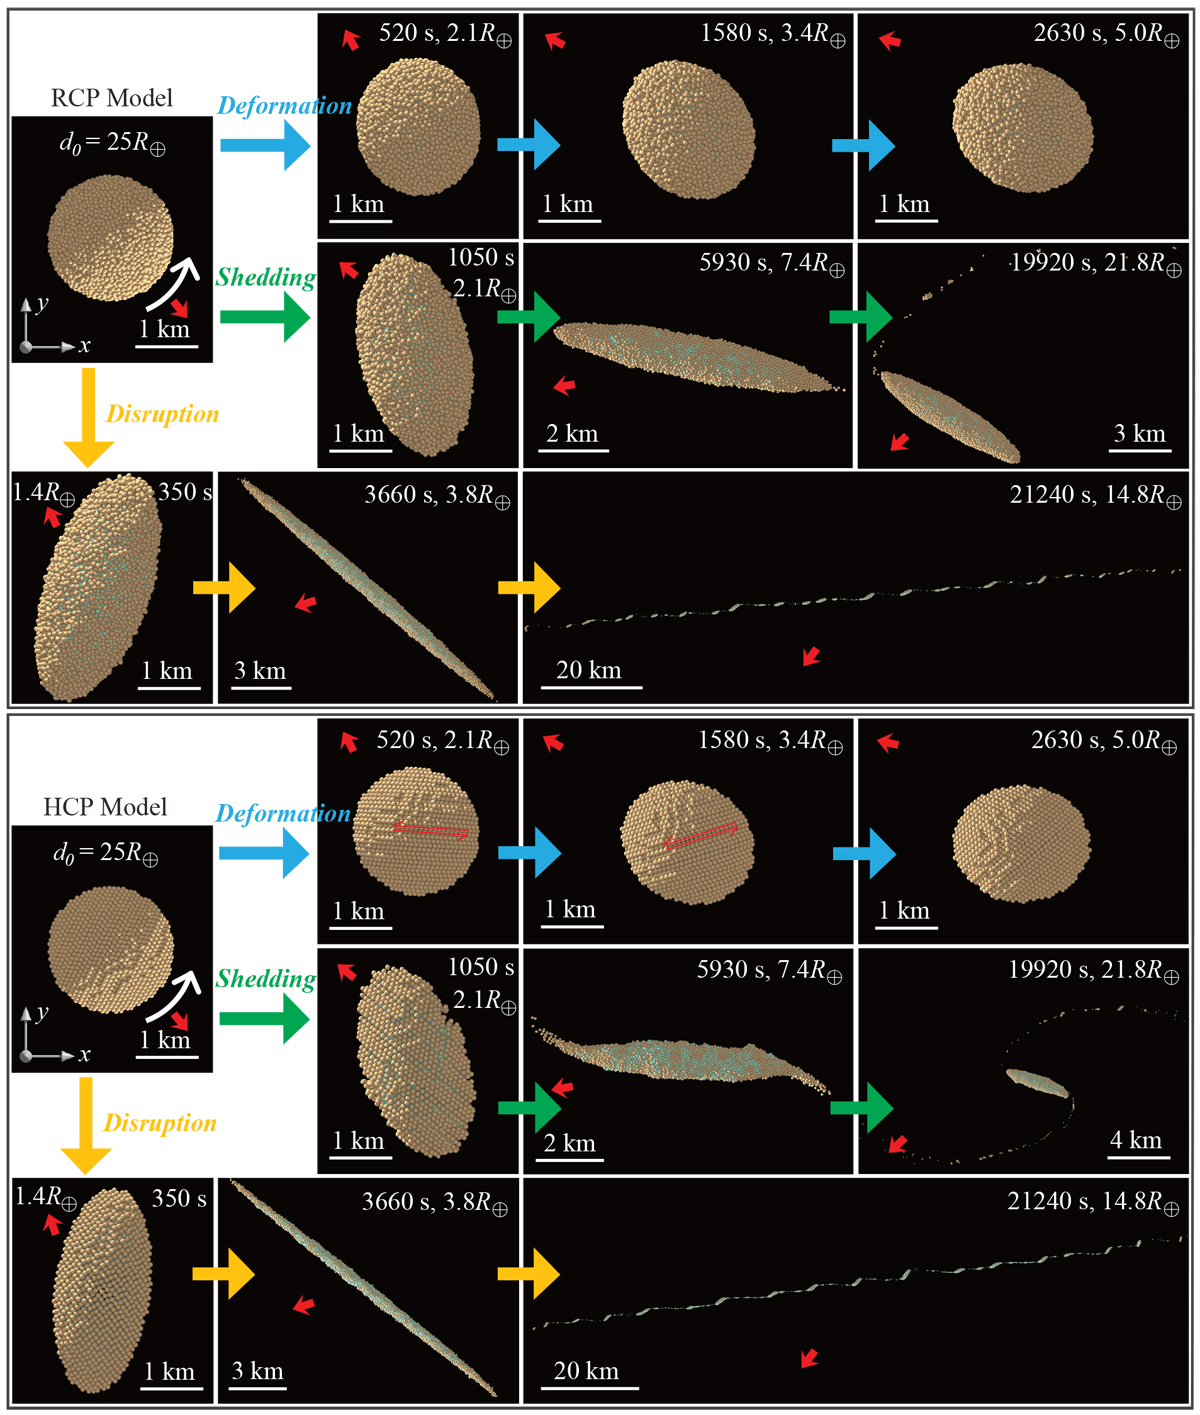
Fig. 2

Snapshots of tidal encounter processes for the three outcome classes, “deformation” with V∞ = 10 km s−1 and q = 1.9 R⊕, “shedding” with V∞ = 6 km s−1 and q = 1.6 R⊕, and “disruption” with V∞ = 2 km s−1 and q = 1.3 R⊕, of the RCP (upper frame) and HCP (lower frame) models. The line of sight is in a direction perpendicular to the orbital plane (the same as Fig. 1), and the light rays are ejected from the Earth to illustrate the Earth’s direction (as indicated by the chunky red arrows in each snapshot). The top-left snapshot in each frame shows the start of each run, where the rubble pile rotates in a prograde direction. Time proceeds from left to right in each row. The values of time relative to the perigee and distance to the Earth’s center are indicated on the top of each snapshot. Particles of the rubble pile at the surface are colored in yellow and interior ones are colored in green. The thin red lines with arrows in the two middle snapshots of the HCP “deformation” case highlight the sliding motion between the two hemispheres of the HCP packing. An animation of each case shown in this figure is available online.
Current usage metrics show cumulative count of Article Views (full-text article views including HTML views, PDF and ePub downloads, according to the available data) and Abstracts Views on Vision4Press platform.
Data correspond to usage on the plateform after 2015. The current usage metrics is available 48-96 hours after online publication and is updated daily on week days.
Initial download of the metrics may take a while.


