Fig. 10
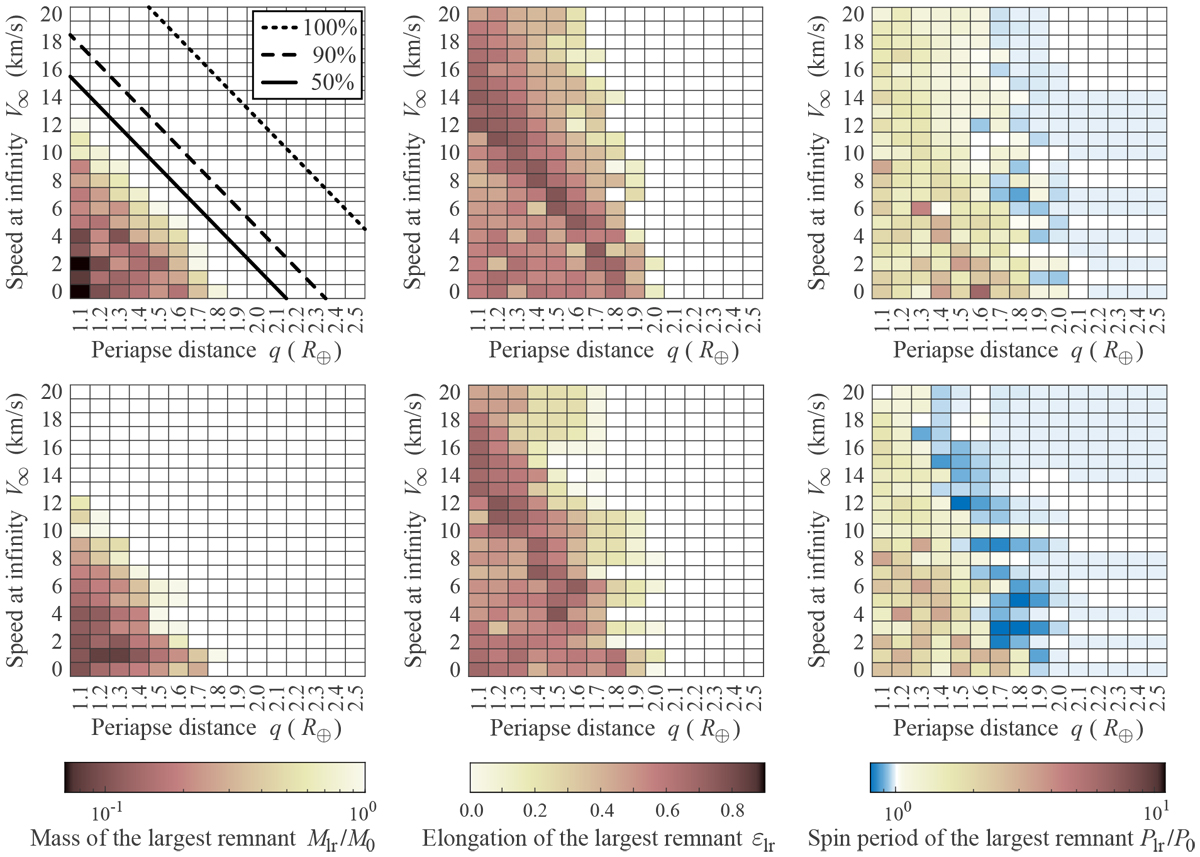
Similar to Fig. 6 but for the HCP model with different resolutions, where N = 2953 for the first row and N = 11 577 for the second row. The three lines plotted on the top-left panel indicate the tidal disruption mass loss outcomes of previous simulations using the HSDEM (based on Fig. 1 in Schunová et al. 2014), where above the“100%” line the progenitor has no mass loss, below the “90%” line more than 10% of the progenitor’s original mass is lost, below the “50%” line the mass loss is larger than half of the original mass M0 (see Sect. 4).
Current usage metrics show cumulative count of Article Views (full-text article views including HTML views, PDF and ePub downloads, according to the available data) and Abstracts Views on Vision4Press platform.
Data correspond to usage on the plateform after 2015. The current usage metrics is available 48-96 hours after online publication and is updated daily on week days.
Initial download of the metrics may take a while.