Fig. 9.
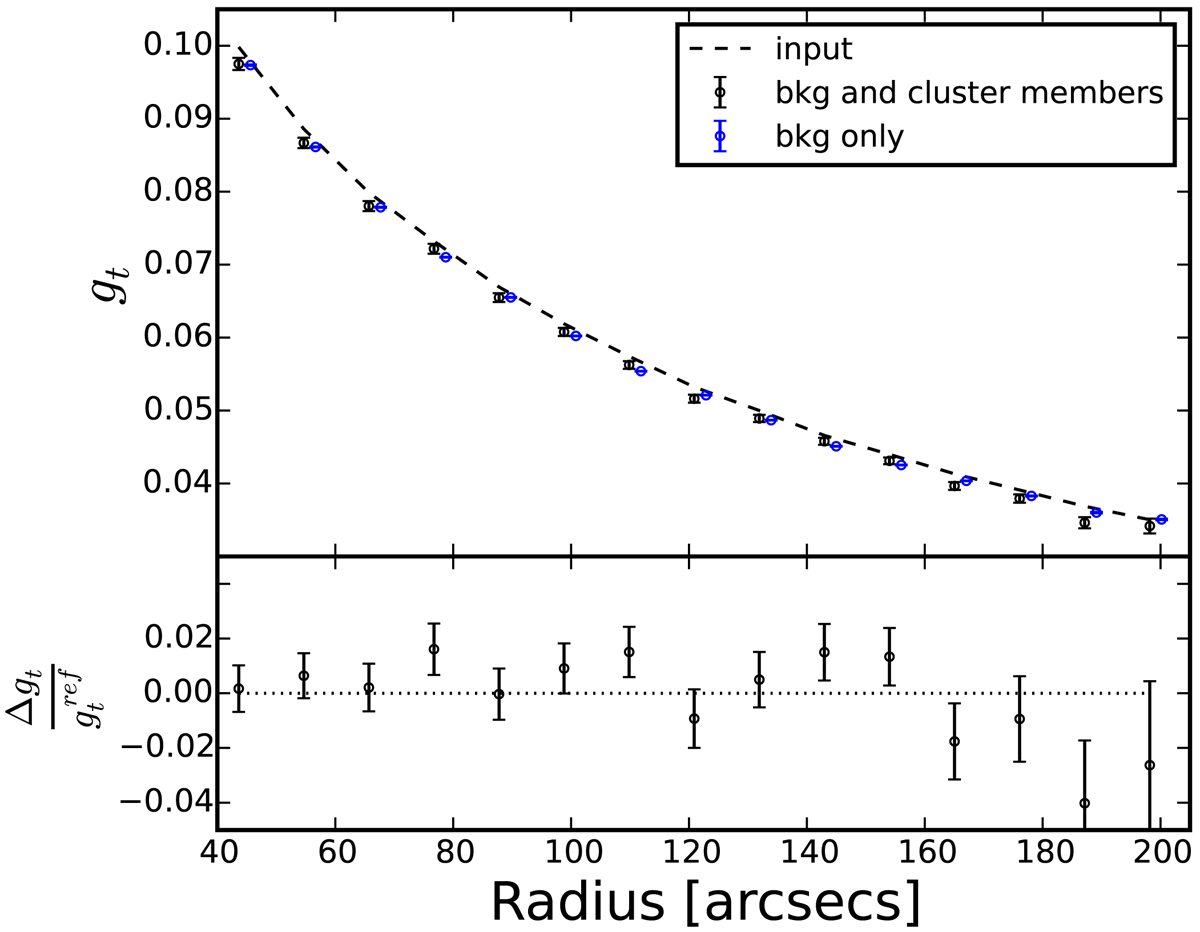
Averaged tangential shear profile of multiple simulations of background galaxies sheared following an NFW profile with (in black) and without (in blue) the presence of cluster member galaxies. Here we average the profiles of all simulated clusters at z > 0.7. The dashed line represents the average input profile. The bottom panel shows the relative difference between the tangential shears of the simulations with and without cluster member galaxies as a function of radius.
Current usage metrics show cumulative count of Article Views (full-text article views including HTML views, PDF and ePub downloads, according to the available data) and Abstracts Views on Vision4Press platform.
Data correspond to usage on the plateform after 2015. The current usage metrics is available 48-96 hours after online publication and is updated daily on week days.
Initial download of the metrics may take a while.