Fig. 6.
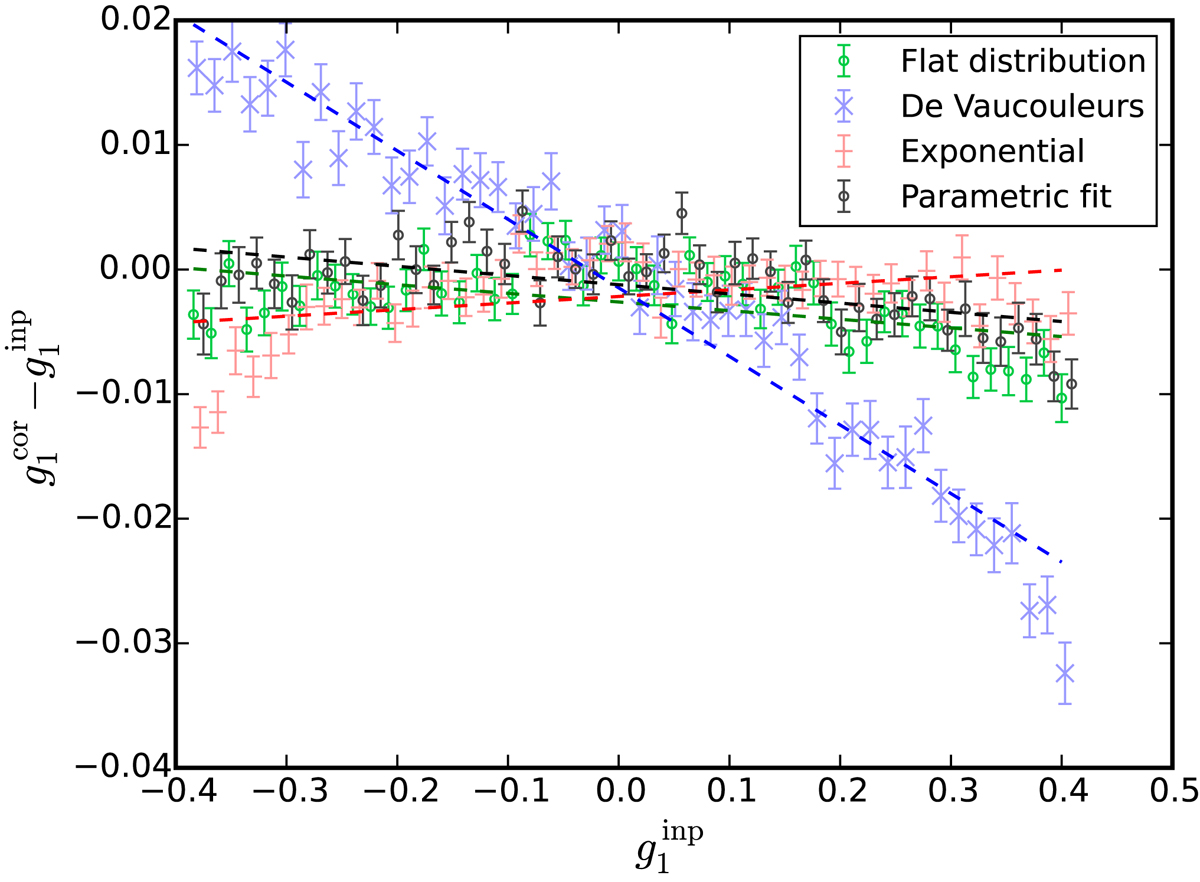
Residual bias estimation for simulations with different input light profile distributions. The different symbols correspond to the different light profiles used to create the mock galaxies. We show the cases of a flat Sérsic index distribution in green, a purely De Vaucouleurs profile in blue, a purely exponential in red, and the more realistic case of the parametric fit to the COSMOS galaxies in grey. For the result shown here the S/NKSB-dependent correction from Eq. (13) and the S/Nflux > 10 cut have been applied. The causes of the deviation of some points at strong shear are discussed in Sect. 3.6. The indicated fits have been computed from the |g| < 0.2 range, but we present the estimates for the full |g| < 0.4 range.
Current usage metrics show cumulative count of Article Views (full-text article views including HTML views, PDF and ePub downloads, according to the available data) and Abstracts Views on Vision4Press platform.
Data correspond to usage on the plateform after 2015. The current usage metrics is available 48-96 hours after online publication and is updated daily on week days.
Initial download of the metrics may take a while.