Fig. B.1.
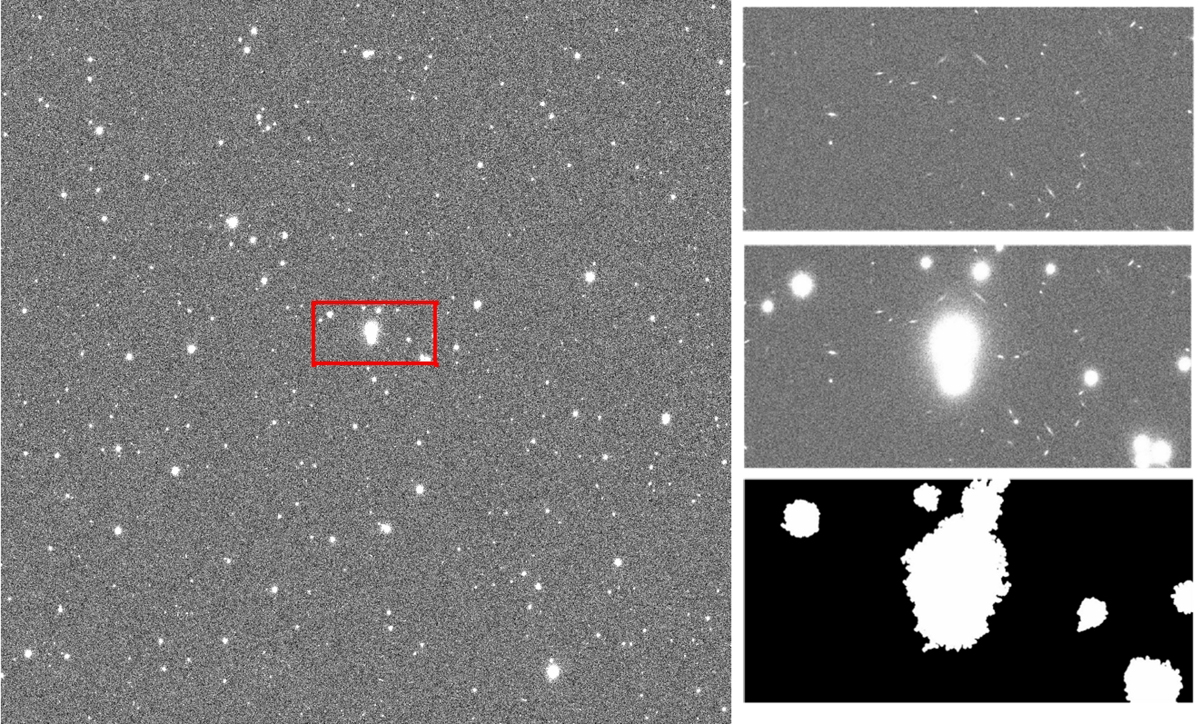
Example image of a simulated cluster at z = 0.28. A cut-out of the full image, shown in red, can be seen in the right for the simulations with background galaxies only (top), with added cluster members (middle) and showing the mask used to remove bright objects (bottom). The full image and cut outs spans 300″ × 300″ and 50″ × 25″, respectively.
Current usage metrics show cumulative count of Article Views (full-text article views including HTML views, PDF and ePub downloads, according to the available data) and Abstracts Views on Vision4Press platform.
Data correspond to usage on the plateform after 2015. The current usage metrics is available 48-96 hours after online publication and is updated daily on week days.
Initial download of the metrics may take a while.