Fig. 16.
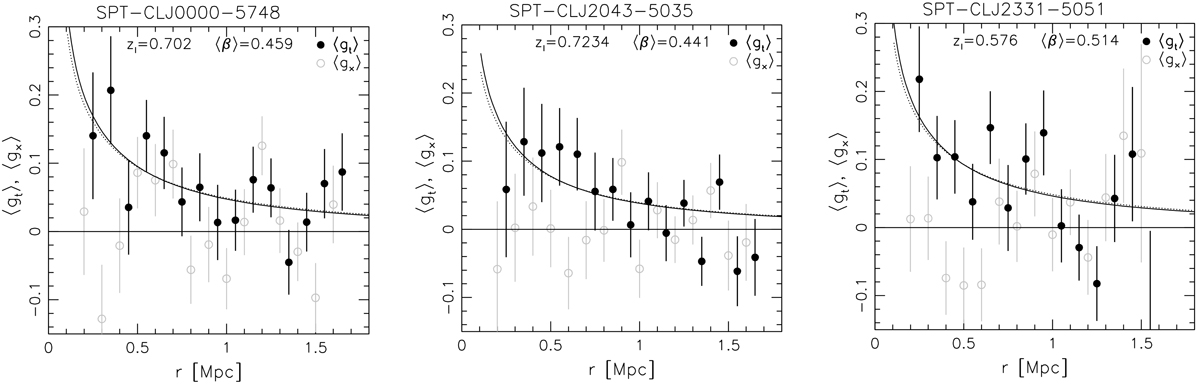
Reduced shear profiles around the X-ray centres of the three relaxed clusters analysed in this study, showing the tangential (black solid circles) and cross (grey open circles) components. The curves correspond to the best-fitting NFW models assuming the D19 c(M) relation (dotted) and increased concentrations ![]() (solid), which are expected to more accurately represent relaxed clusters.
(solid), which are expected to more accurately represent relaxed clusters.
Current usage metrics show cumulative count of Article Views (full-text article views including HTML views, PDF and ePub downloads, according to the available data) and Abstracts Views on Vision4Press platform.
Data correspond to usage on the plateform after 2015. The current usage metrics is available 48-96 hours after online publication and is updated daily on week days.
Initial download of the metrics may take a while.