Fig. 10.
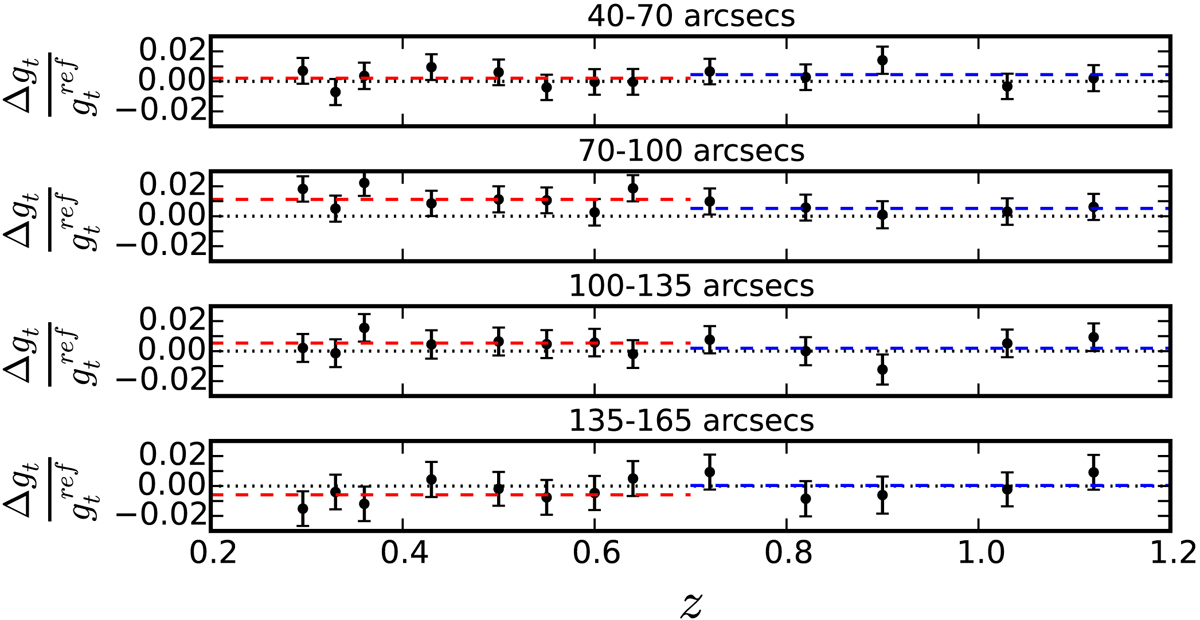
Relative difference of the measured tangential shears of the simulations with and without cluster member galaxies as a function of cluster redshift. The four panels show the values in different distance bins. The dotted black line represents the zero line for reference and the dashed line shows the mean of the points for clusters at z < 0.7 (red) and z > 0.7 (blue).
Current usage metrics show cumulative count of Article Views (full-text article views including HTML views, PDF and ePub downloads, according to the available data) and Abstracts Views on Vision4Press platform.
Data correspond to usage on the plateform after 2015. The current usage metrics is available 48-96 hours after online publication and is updated daily on week days.
Initial download of the metrics may take a while.