Fig. 1.
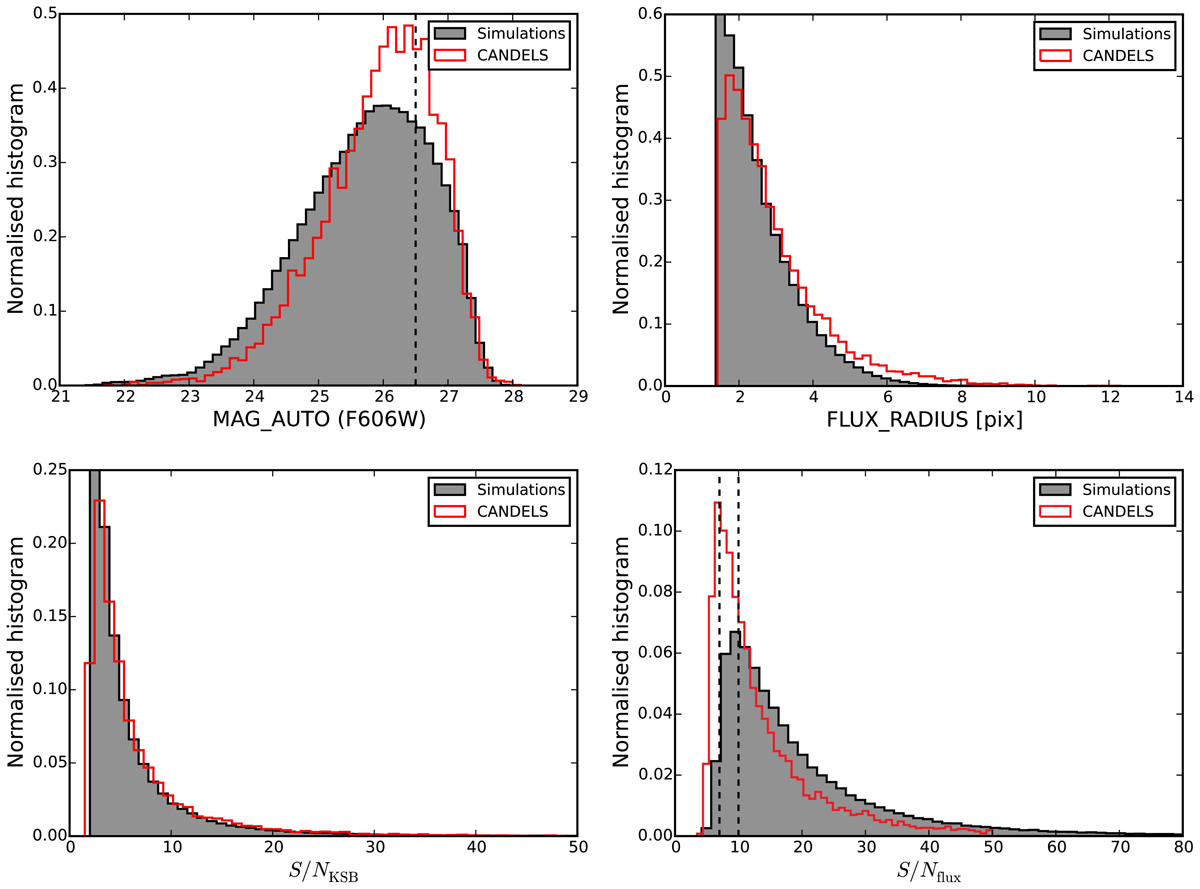
Comparisons between the measured distributions in our simulations and the CANDELS data for the F606W magnitudes, the half-light radius, the KSB signal-to-noise ratio S/NKSB, and the SExtractor signal-to-noise ratio S/Nflux. The vertical lines in the MAG_AUTO distribution indicate the magnitude cuts we introduce for the bias estimation. The two vertical lines in the S/Nflux distribution show the two different signal-to-noise ratio cuts that we apply in this work.
Current usage metrics show cumulative count of Article Views (full-text article views including HTML views, PDF and ePub downloads, according to the available data) and Abstracts Views on Vision4Press platform.
Data correspond to usage on the plateform after 2015. The current usage metrics is available 48-96 hours after online publication and is updated daily on week days.
Initial download of the metrics may take a while.