Fig. 2.
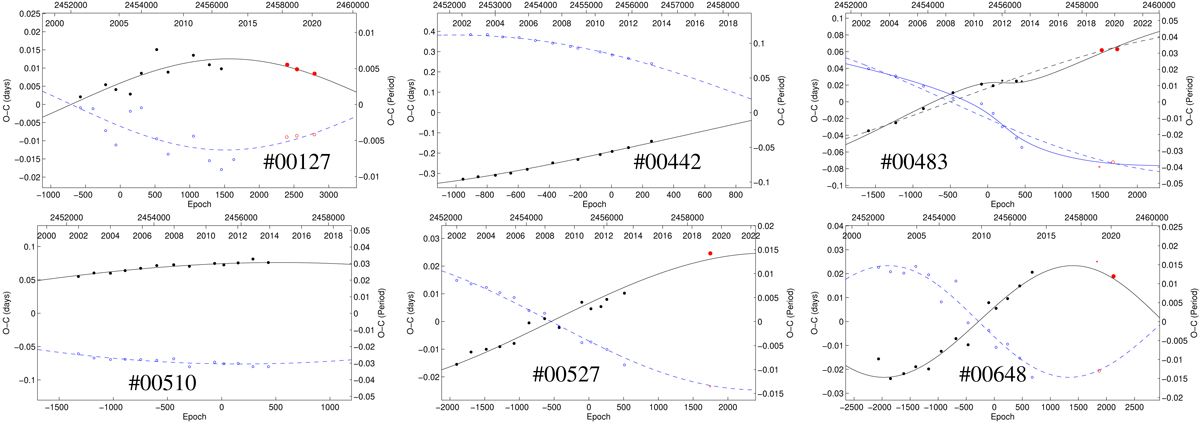
Sample of plots of the O − C diagrams, full set of figures is in appendix section. Final fits of the apsidal motion are plotted as black and blue curves (for primary and secondary minima), while the individual points represent the times of eclipses. The larger the symbol, the higher the weight (which was assigned according to its uncertainty). New observations with DK154 are shown in red. In cases where an additional third body was found, the final fit is plotted (solid lines) together with only the apsidal motion fits (dashed lines).
Current usage metrics show cumulative count of Article Views (full-text article views including HTML views, PDF and ePub downloads, according to the available data) and Abstracts Views on Vision4Press platform.
Data correspond to usage on the plateform after 2015. The current usage metrics is available 48-96 hours after online publication and is updated daily on week days.
Initial download of the metrics may take a while.