Fig. B.1.
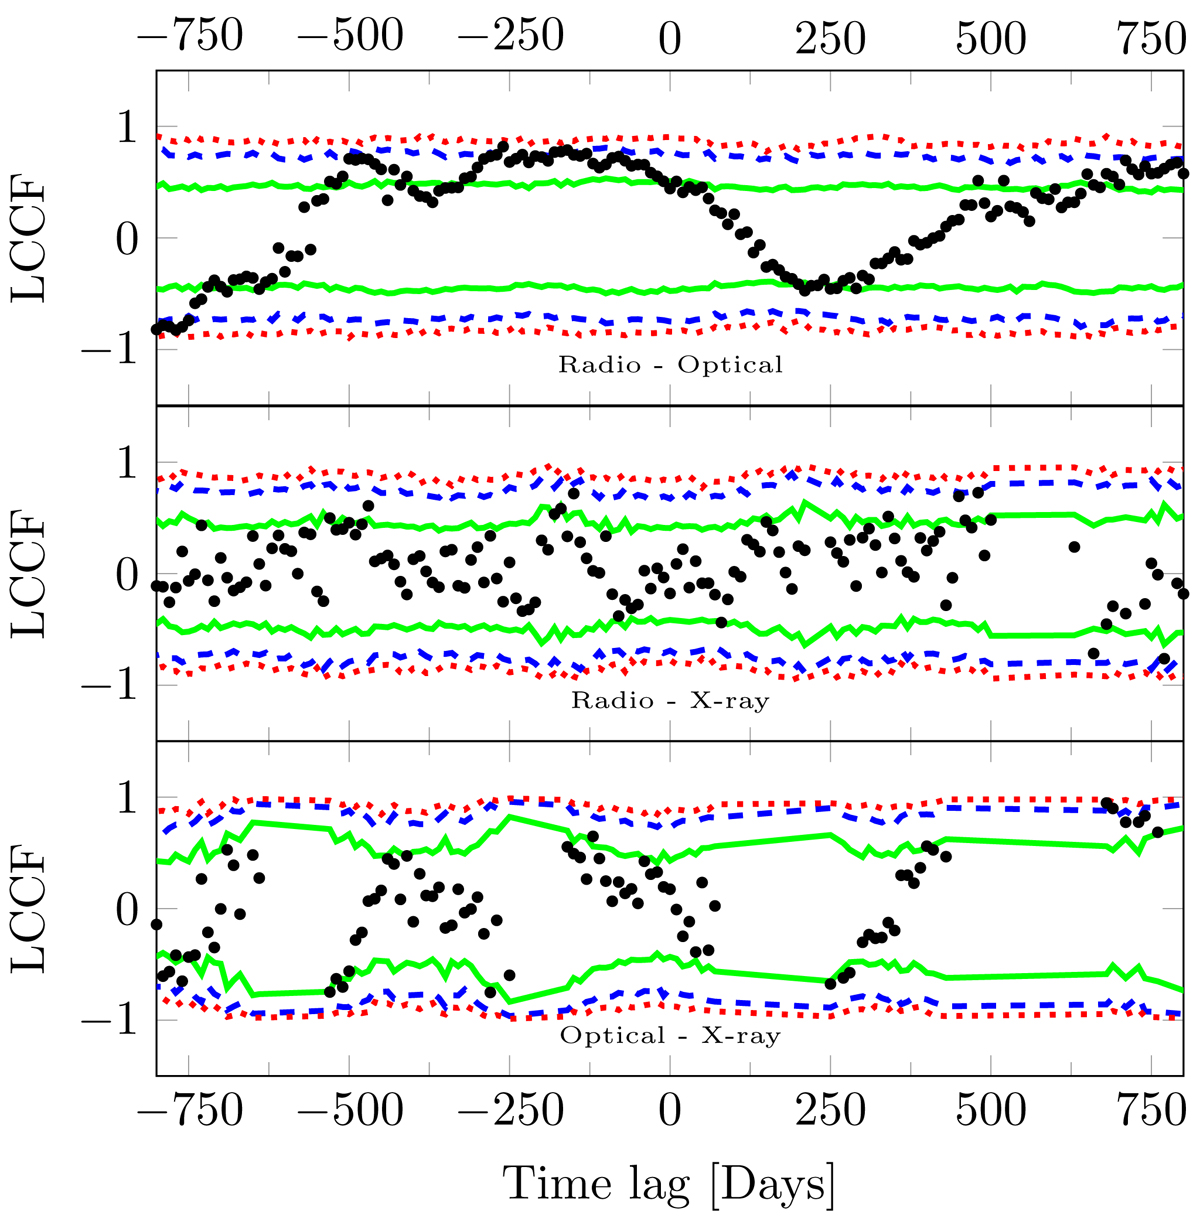
Results of the LCCF study of VER J0521+211: (top) between radio (15 GHz) and optical (R-band); (middle) between radio (15 GHz) and X-ray (2–10 keV); and (bottom) between optical and X-ray (2–10 keV). We show 1σ (green solid line), 2σ (blue dashed line), and 3σ (red doted line) significance limits. Positive significant lags show that the flare at lower frequency is preceding the other band.
Current usage metrics show cumulative count of Article Views (full-text article views including HTML views, PDF and ePub downloads, according to the available data) and Abstracts Views on Vision4Press platform.
Data correspond to usage on the plateform after 2015. The current usage metrics is available 48-96 hours after online publication and is updated daily on week days.
Initial download of the metrics may take a while.