Fig. 8.
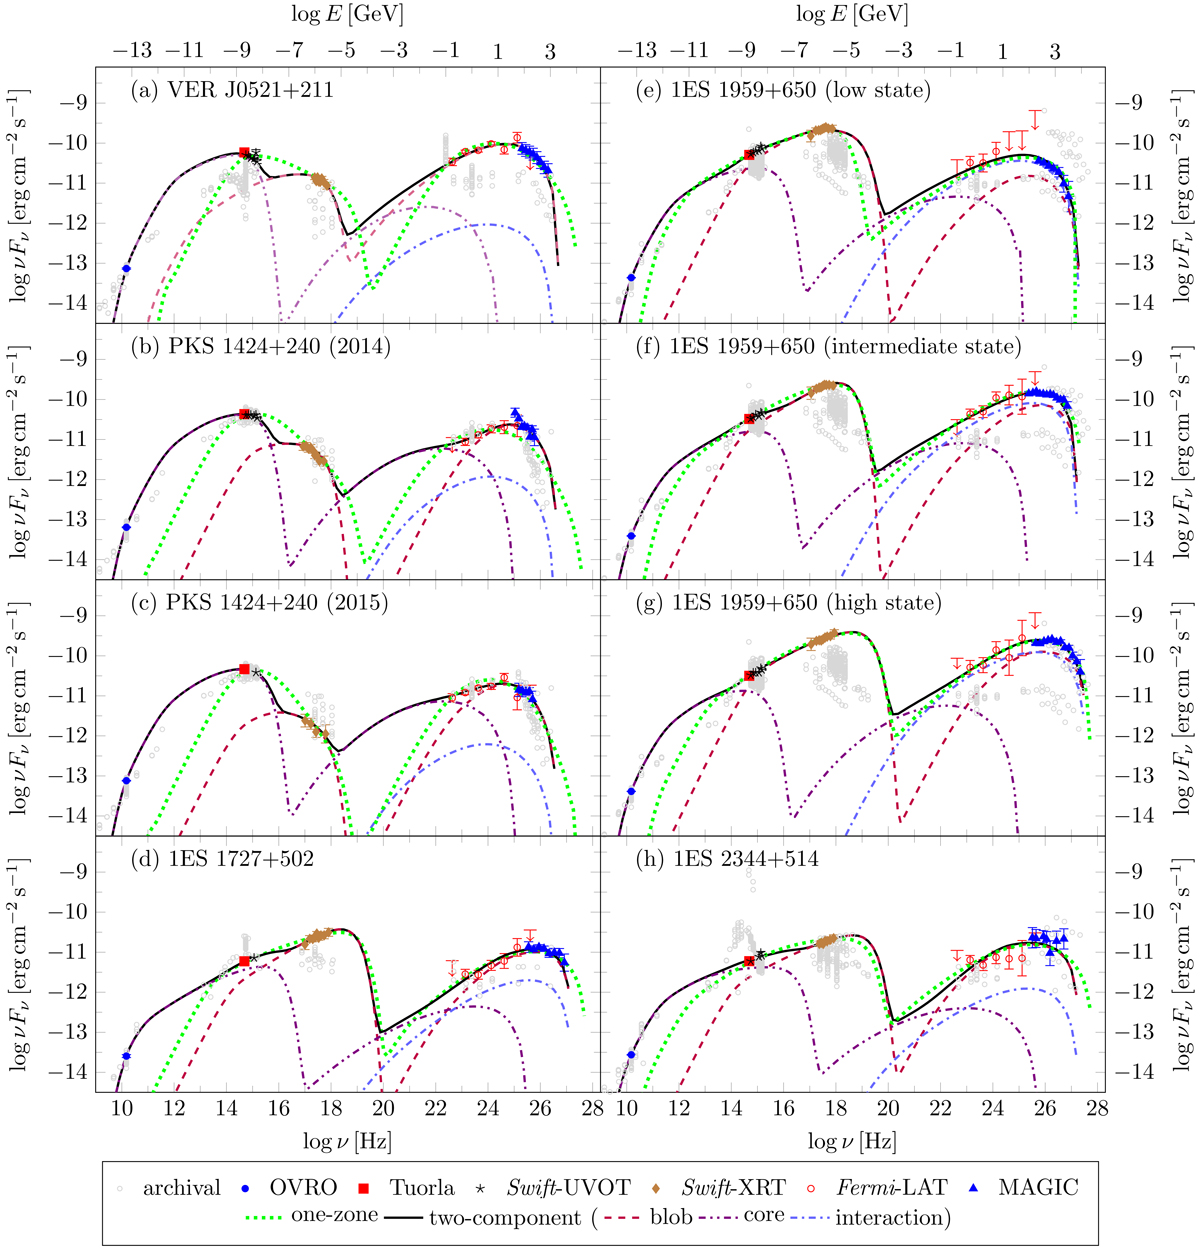
Broadband SED of the source sample during the selected observation epochs/time. The details of the data selection for each SED is presented in Appendix D. The spectral data points in the panels are: archival non-simultaneous data from the ASI Space Science Data Centre, grey open circles; radio data (15 GHz) from OVRO, blue circle; optical (R-band) from Tuorla, red square; optical and UV data from Swift-UVOT, black stars; X-ray data from Swift-XRT, brown diamonds; HE gamma-ray data from Fermi-LAT, red open circles; and de-absorbed VHE gamma-ray data from MAGIC, blue triangles. The SEDs are modelled within the one-zone SSC (green dotted lines) and two-component scenario (black lines). Within the two-component scenario, the violet dash double dotted and purple dashed lines show the emission from the core and the blob, respectively. Moreover, the result of interaction between emissions from the blob and the core are plotted with blue dash-dotted lines.
Current usage metrics show cumulative count of Article Views (full-text article views including HTML views, PDF and ePub downloads, according to the available data) and Abstracts Views on Vision4Press platform.
Data correspond to usage on the plateform after 2015. The current usage metrics is available 48-96 hours after online publication and is updated daily on week days.
Initial download of the metrics may take a while.